If you eyeballed metals and mining a month ago, the headline almost wrote itself. The SPDR S&P Metals & Mining ETF (NYSEARCA:XME) closed May 11 at $124.54 and pushed to $128.53 by June 3, outpacing the S&P 500 on a year-to-date basis by a multiple that justified the “doubled the index” framing. Then the last five sessions happened. XME dropped roughly 13% in a week, closed at $112.43 on June 10, and the framing lost its grip.
Here is the arithmetic as it stands this morning, the honest version. XME is up roughly 9% year to date from a starting price of $103.55 on December 31, 2025. The SPDR S&P 500 ETF Trust (NYSEARCA:SPY) is up roughly 6% over the same window. A lead, but a slim one, and the “doubled” framing only really applies if you froze the chart at June 3 or if you stretch the lens out twelve months. On that longer view, the gap is enormous. XME is up roughly 74% over one year against the S&P 500’s roughly 20%. That is the run that earned the attention. The YTD number is what is left of it after a brutal week.
What Actually Did the Work
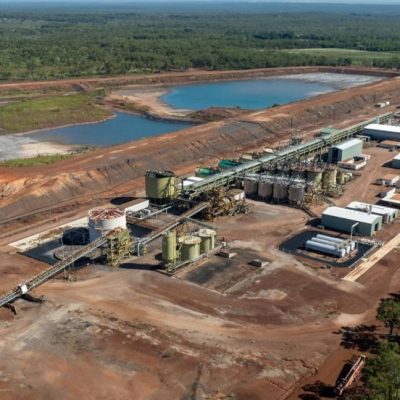
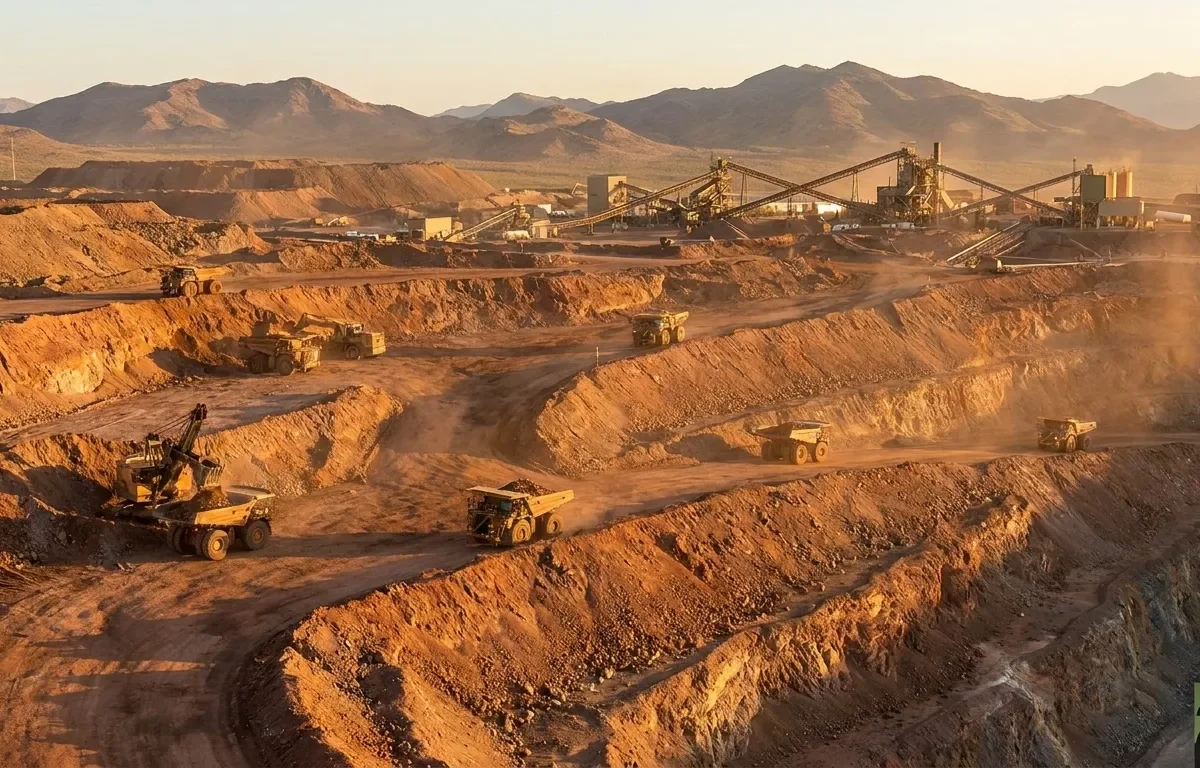
The mechanism here is straightforward. XME is a roughly equal-weighted basket of US metals and mining names, with no single position above 5.02% of net assets and the top ten holdings combining for roughly 45% of the fund. That spread across coal (Warrior Met, Peabody), steel (Nucor, Steel Dynamics), copper (Freeport McMoRan), aluminum (Alcoa), uranium (Uranium Energy), and gold (Newmont) is the entire personality of the fund. When one corner of the commodities complex rallies, XME inches. When they all rally at once, XME flies.
They all rallied at once. Global copper prices ran from a 12-month low of $9,671.88 per metric ton in August 2025 to $13,483.75 in May 2026, currently sitting in the 91.7th percentile of the trailing year. The broader Producer Price Index for all commodities hit 283.76 in April 2026, a 12-month high in the 90.9th percentile. Two of the most-watched commodity pricing series in the world peaked together. The equal-weight basket caught every leg.
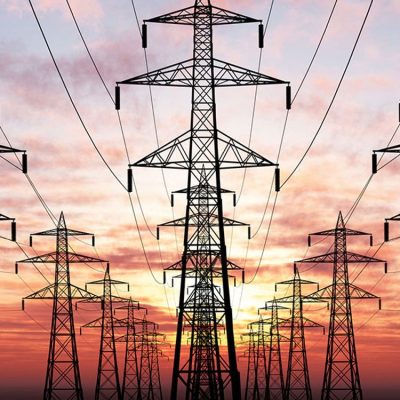
The story behind the prices is the part worth telling at the kitchen table. Copper is the wire in everything that is being built right now, and what is being built right now is power. The US grid is straining under AI data center load, with Goldman Sachs noting that grid infrastructure averages 40 years old while data center demand surges. Renewables are roughly 2.5 times more labor-intensive than fossil fuels across their lifecycle, which means more steel, more aluminum, more wiring per megawatt installed. Uranium has been pulled along by the same AI-power thesis as utilities recommit to nuclear baseload. Silver and platinum group metals have a real AI-hardware demand story underneath the speculation, which is part of why Seeking Alpha’s Mike Zaccardi upgraded XME to BUY in January, citing a 96% year-over-year rally, a P/E of about 15x, and a technical target of $137.
Layered on top is the policy backdrop. A bipartisan report flagged Beijing’s decades-long manipulation of critical mineral prices as a national-security issue and recommended a Strategic Resource Reserve and a Critical Minerals Czar. That kind of framing has a way of pulling capital into domestic miners regardless of where spot prices sit on any given Tuesday. The Goldman 2026 outlook explicitly flagged economic security, supply chains, and resources as a megatheme for the year. XME is the most direct ETF expression of that theme in the US market.
The Expense and the Texture
XME charges a net expense ratio of 0.35%, run by State Street, with the fund holding 35 stocks and a portfolio value around $3.41 billion as of the December 2025 N-PORT filing. The dividend yield is a token 0.33%, which is the right number for a fund whose entire job is capital appreciation tied to the commodity cycle. It is a clean cyclical bet built for capital appreciation, which is why it moves the way it does in both directions.
What Has To Hold For The Next Leg
The five-year picture (up about 150%) and the ten-year picture (up about 444%) tell you the secular setup has been kind. The week-over-week picture tells you that kindness is conditional. Three things determine whether XME’s lead over the S&P 500 widens back out or keeps compressing.
Copper is the first. The FRED series PCOPPUSDM was up 4.6% month-over-month from April to May 2026, but the metal is also sitting at the high end of its 12-month range. If copper holds above $12,500, the rally has a floor under it. If it round-trips back toward the August 2025 low near $9,700, half the bullish thesis goes with it. The second is the AI capex thesis itself, which Goldman frames as the “uneasy equilibrium” supporting the entire 2026 market. A meaningful unwind of AI-related spending pulls power demand, copper demand, and uranium demand lower in sequence. The third is policy. If a Critical Minerals reserve actually gets funded, domestic miners get a buyer of last resort. If the conversation stalls past the November 2026 midterms, the policy tailwind thins out.
XME’s one-year return tripled the S&P 500 because every commodity it touches rallied at once inside an AI-driven power buildout, and a once-in-a-decade alignment of copper, uranium, steel, and gold does not repeat on demand. The YTD lead has already compressed from “doubled” to “narrow” in the span of one week, which is what regime-dependent rallies do when one input wobbles. The setup is broadly intact at much higher prices, and that changes the expected return even if the direction stays the same. The thing to watch is copper at $12,500, the PPI all-commodities series rolling over from its 90th-percentile perch, and any softening in the AI capex headlines that have been holding the whole structure up. When those three start moving the wrong way together, the equal-weight basket that caught every leg up will catch every leg down with the same efficiency.