


*This article is an edited and reorganized version for note based on the content of a video released on Yoshihiro Asakawa’s YouTube channel, ‘The Depths of the World’.
Where does the image that “agriculture is declining” come from?
The number of people involved in agriculture is decreasing. Production volume is also lower than it once was. Looking only at these figures, it appears that Japanese agriculture is continuing to shrink.
However, whether an industry is growing cannot be judged by the number of people alone. How much is produced per person, or per hour, and how much revenue is generated? By combining long-term statistics, we will examine the reality of Japanese agriculture.
1. View agricultural growth by “per person”
Is agriculture declining, or is it growing? To consider this question, we must first organize the criteria by which we judge it.
Agriculture is an industry. We cannot judge it as declining simply because the number of people working in it has decreased. What is important is how production volume, revenue, and labor productivity per person have changed.
As a result, if it has become possible to produce the same amount with fewer people, we can understand this as development, not decline.
Agricultural economist Dr. Theodore Schultz (winner of the 1979 Nobel Prize in Economics) also argued that productivity improvement through investment in technology and knowledge is the key to agricultural development.
Japanese agriculture is the same. We will verify its growth based on long-term changes in productivity, not the number of workers.
The first thing we will check is the statistics on how much production volume agricultural and forestry workers produced in one year.
Note that the productivity analysis in this article uses statistics for “agriculture and forestry,” which includes not only agriculture but also forestry. Since the Ministry of Agriculture, Forestry and Fisheries does not have data that can track the entire agricultural workforce, including employees, over the long term using a unified standard, we adopted the Ministry of Internal Affairs and Communications’ “Labor Force Survey.” However, since the number of workers in that survey combines agriculture and forestry, to maintain consistency in calculations, production volume and output value are also calculated including forestry.
In 1961, the annual production volume per agricultural and forestry worker was 10 tons. By 2024, it reached 47 tons. In about 60 years, it has increased about fivefold.
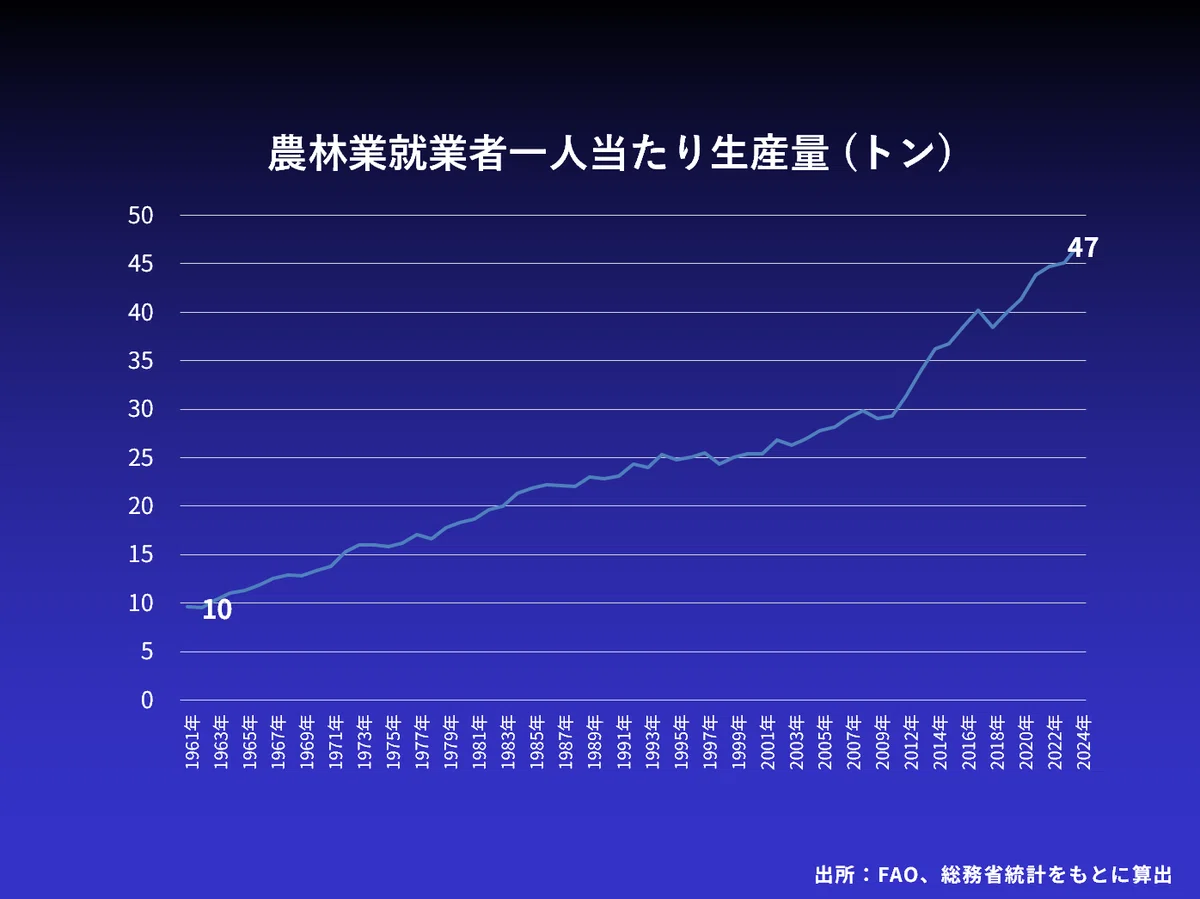
The annual production volume per agricultural and forestry worker has increased nearly fivefold in about 60 years. The view that “agriculture is declining” ignores this improvement in productivity. Rather, these are figures that show that Japanese agriculture has been steadily developing.
Then why is the image of decline so deeply rooted in agriculture?
A major reason for this is the decrease in the number of people involved in agriculture. The number of agricultural and forestry workers has decreased by about 90%, from 14.87 million in 1953 to 1.74 million in 2024.
On the other hand, although the annual production volume of agricultural and forestry products decreased from 118.67 million tons in 1961 to 84.47 million tons in 2024, the rate of decrease is only about 29%. Moreover, it has been recovering since bottoming out around 2009.
Even though the number of workers has decreased by about 90%, production volume has maintained about 70%. This difference is exactly what speaks to the improvement in productivity of Japanese agriculture that cannot be seen by the decrease in the number of people alone.
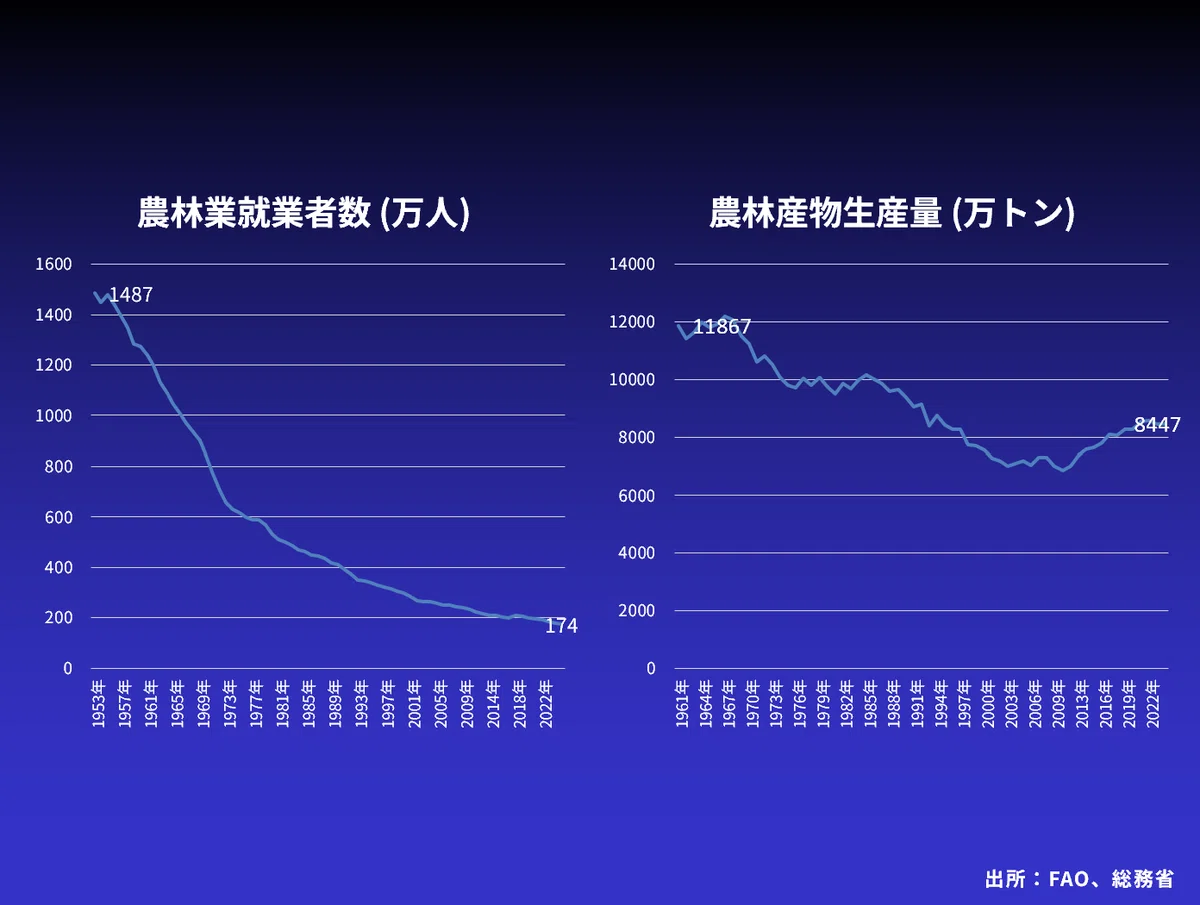
The statistics this time are calculated by totaling the production volume of all agricultural, forestry, and livestock products, including grains, vegetables, fruits, industrial crops, meat, eggs, dairy products, and forest products, and dividing it by the number of agricultural and forestry workers. In recent years, forestry and livestock farming have been supporting the production volume of agricultural and forestry products. In forestry, demand for domestic timber has recovered to a certain extent against the backdrop of rising overseas timber prices.
In livestock farming, while the number of farming households is decreasing, production volume has increased due to the expansion of management scale and improvements in production technology.
With changes in demand, the production volume of individual items within agriculture fluctuates, and the composition of production also changes.
For example, meat production increased from approximately 1.33 million tons in fiscal year 1965 to approximately 3.47 million tons in fiscal year 2022. Meanwhile, the production of rice, the staple grain, decreased from approximately 12.41 million tons to approximately 8.07 million tons during the same period.
What is important in observing the development trends of agriculture and forestry as a whole is not the increase or decrease of individual items, but how production per capita has changed over the long term.
2. The decrease in farmers is not because of decline
What is important when considering industrial development is not the number of people working, but how much one person can produce.
Even if the number of farmers were to increase, if production per capita decreases, productivity declines. Conversely, even if the number of workers decreases, if production per capita has increased, it cannot be judged as a decline based solely on the reduction in numbers.
In Japanese agriculture, mechanization has made it possible to cultivate large areas of farmland with fewer people. Through selective breeding, yields per unit area have increased, and there have been advancements in fertilizer and pesticide application techniques and effectiveness. Harvesting work can also now be done in a much shorter time than before.
This accumulation of technological innovation has raised productivity per capita and reduced the labor force required for agriculture.
Let us consider the relationship between the number of people required for agriculture and productivity.
If demand is 100, 100 people are needed if one person can only produce 1. If one person can produce 2, 50 people are needed, and if one person can produce 10, 10 people can meet the demand.
In other words, if demand does not change, the number of workers required decreases as production per capita increases. The labor force required for agriculture is greatly influenced by the demand for agricultural products and productivity.
Therefore, the decrease in the number of farmers cannot be explained solely by aging or the reason that “agriculture is not profitable.” This is because if productivity improves, even a small number of people can supply the agricultural products that society needs.
This is not a phenomenon unique to Japan. Agriculture in countries around the world has also developed in the direction of producing more agricultural products with less labor through mechanization and technological innovation.
Conversely, even if the number of farmers increases significantly, if production volume hardly increases, productivity per capita declines. One cannot simply evaluate it as “growth because the number of farmers increased and production volume increased slightly.”
It is not about how many farmers there are, but how much they have become able to produce with that number. Therein lies an important indicator for measuring the development of agriculture.
3. The number of agricultural workers also changes depending on the season of the year
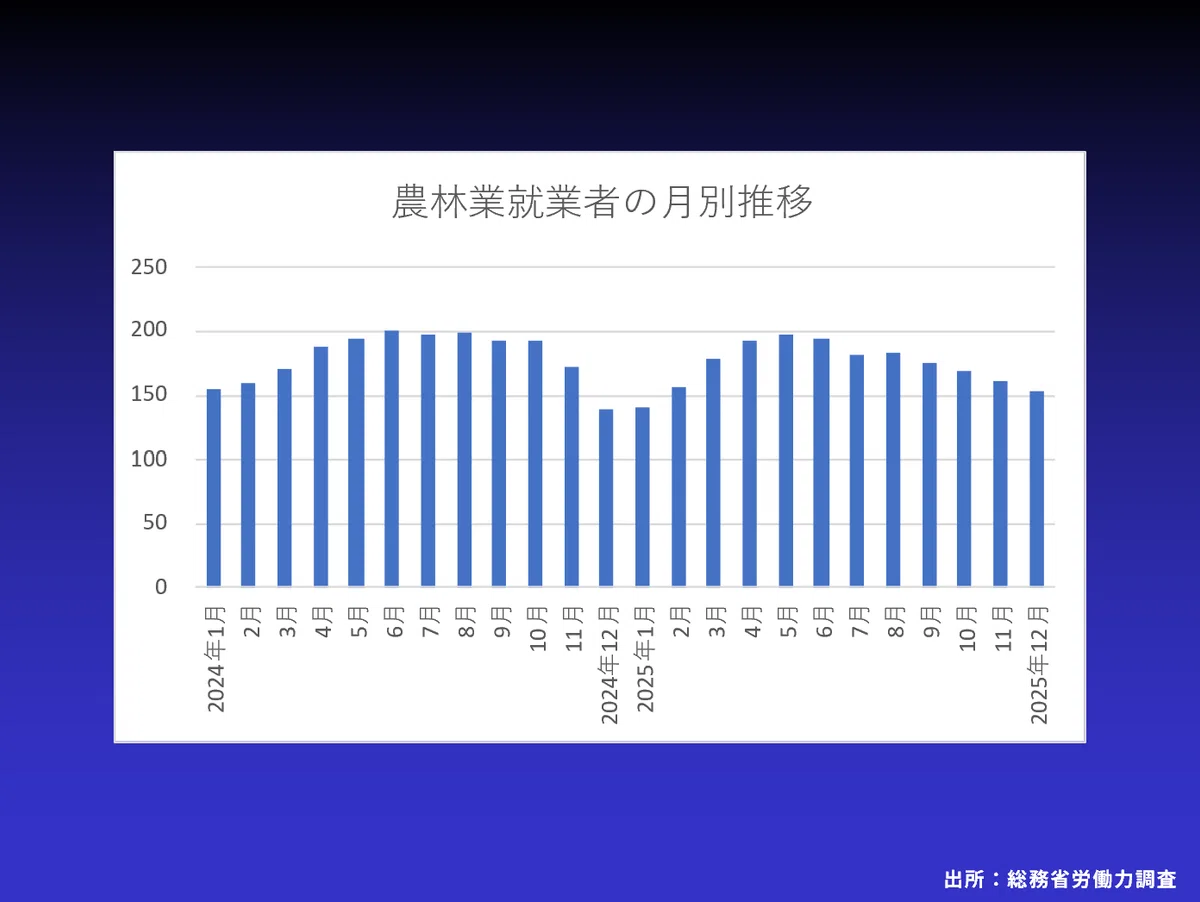
The number of people involved in agriculture is not only decreasing in the long term. It also fluctuates significantly throughout the year.
The Ministry of Internal Affairs and Communications’ “Labor Force Survey” examines every month what kind of work the survey subjects did during the week at the end of the month and how many hours they worked.
Looking at the number of people employed in agriculture and forestry from January 2024 to December 2025, it is low in winter, increases from spring, peaks around early summer, and then decreases again toward winter. The labor force required for agriculture is not constant throughout the year.
The number of workers increases during busy farming periods and decreases during quiet ones. Even within the same farm, there are times when people work hard and times when they do not work as much. This graph illustrates the reality that labor demand in agriculture fluctuates by season.
On the other hand, regarding the number of farms, it is sometimes reported that “the number of farms has plummeted” based on data such as the Census of Agriculture and Forestry conducted every five years. However, a decrease in the number of farms is not the same as a decrease in the labor force actually engaged in agriculture.
Even if someone is formally classified as a farmer, there are cases where they do not actually perform much farm work. If an elderly farmer passes away, the statistical number of farms may decrease. However, how much farm work that person was actually performing right up until their death is a separate issue.
Just because the number of households or individuals counted as farmers has decreased does not necessarily mean that the labor force actually invested in agriculture has decreased at the same rate.
To grasp the reality of agriculture, it is necessary to look separately at attributes like “farm” or the number of households, the number of people actually working, and their labor hours.
4. Production per hour has increased more than fivefold
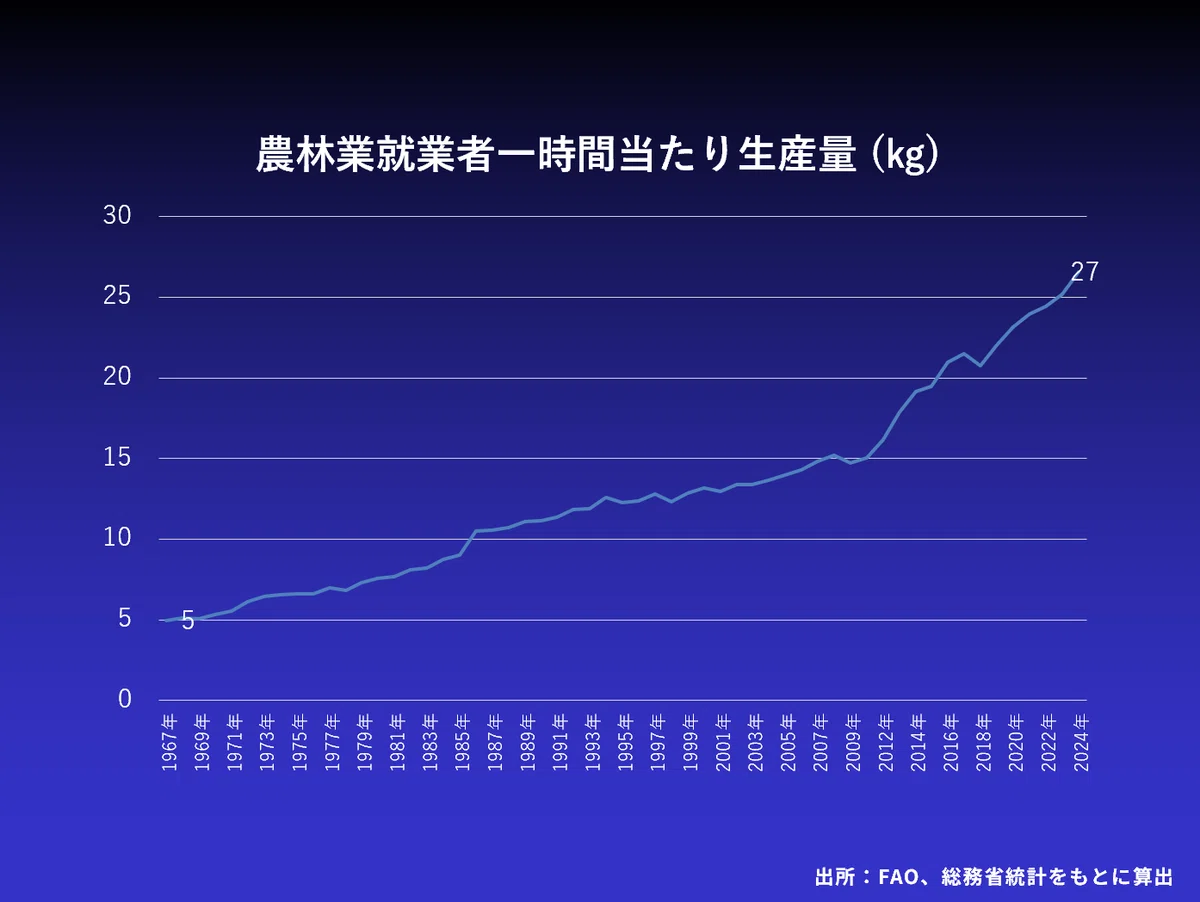
When considering not just annual production volume, but also labor hours, the improvement in the productivity of Japanese agriculture becomes even clearer.
Generally, publicly available statistics do not show the production volume of agricultural and forestry products per hour. Therefore, I combined data from the Ministry of Agriculture, Forestry and Fisheries and the Ministry of Internal Affairs and Communications to calculate it independently.
As a result, the production per labor hour in agriculture and forestry increased from 5 kilograms in 1967 to 27 kilograms in 2024. It has increased more than fivefold over approximately 57 years.
For example, in the case of rice, there are various tasks from planting to harvest, such as plowing, fertilizing, and pesticide application. Production per hour indicates how much was harvested relative to the labor hours spent on those tasks.
There may be an image that agriculture involves repeating the same tasks every year with little change in harvest volume. This is the view that while other industries have undergone repeated technological innovation, only agriculture continues to do the same things as in the past.
However, what long-term statistics show is the fact that production efficiency has also improved significantly in agriculture.
5. Labor hours are one-eighth, while production volume maintains about 70%
That change becomes clearer when comparing the total labor hours spent on agriculture and forestry with the production volume.
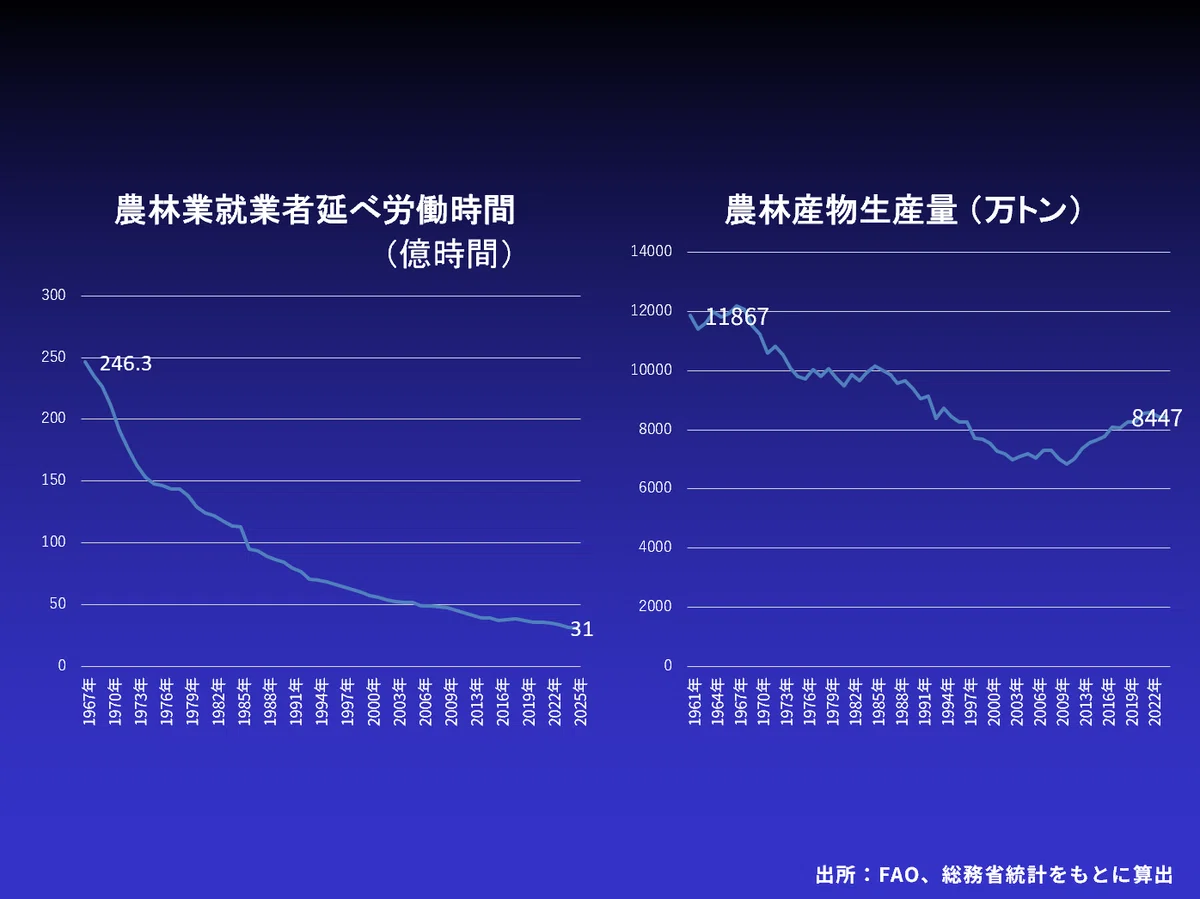
In 1967, the labor hours spent by farmers and employees in agriculture and forestry amounted to 24.63 billion hours per year. By 2025, that had decreased to 3.1 billion hours. The total labor hours for agriculture and forestry have become about one-eighth over approximately 60 years.
On the other hand, the production volume of agricultural and forestry products has not decreased as significantly as labor hours. In other words, it has become possible to produce a substantial amount of agricultural and forestry products with about one-eighth of the labor hours of the past.
Meanwhile, the annual production volume of agricultural and forestry products decreased from 118.67 million tons in 1961 to 84.47 million tons in 2024, but it maintains about 70% of that level.
In the past, many people worked long hours to produce agricultural and forestry products. Currently, even though labor hours are one-eighth, production volume maintains about 70%. This difference is the reason why production per hour has increased significantly.
Admittedly, a decrease in the production volume of individual items does not necessarily mean a decline in agriculture.
Agriculture is also an industry that produces according to demand. The fundamental principle is to produce agricultural products that consumers need and that allow producers to secure profitability. It is not a planned economy where the government dictates production volumes and punishes those who fail to meet them.
As population and dietary habits change, both the types and quantities of agricultural products required also change. In a market economy, it is natural for the production volume of items with decreased demand to fall, while the production volume of items with increased demand grows.
To measure the development of agriculture, it is necessary to look not only at the increase or decrease in production volume but also at how efficiently production has become while responding to changes in demand.
6. The Current State of Agriculture as Seen Through Sales
Up to this point, we have looked at changes in agriculture through production volume. Next is sales.
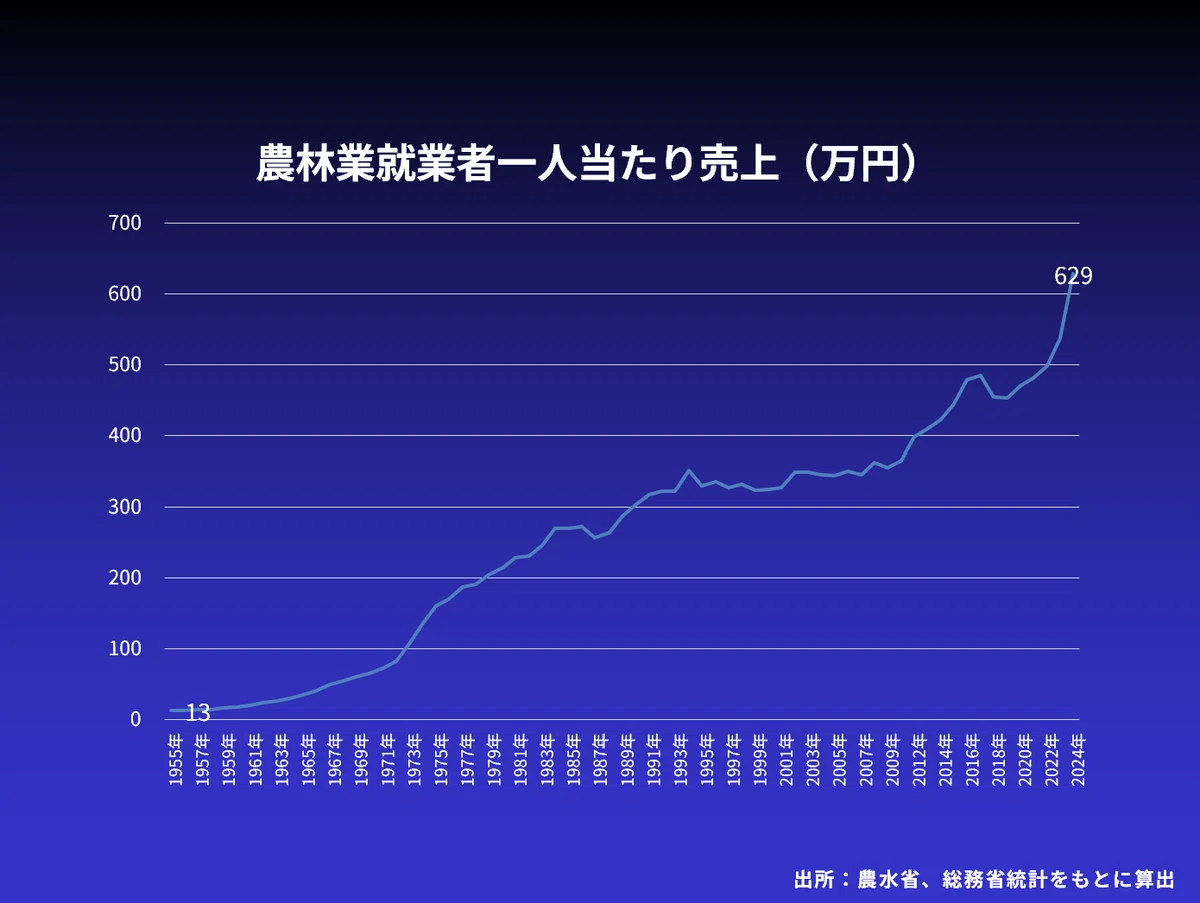
Up to this point, we have looked at changes in agriculture through production volume. Next is sales. The total value of agricultural and forestry products is evaluated in monetary terms as “output value.” In this article, for clarity, it is referred to as “sales.”
Annual sales per person employed in agriculture and forestry have risen from 130,000 yen in 1955 to 6.29 million yen in 2024. This is a comparison based on nominal amounts for each year, without adjusting for inflation.
6.29 million yen is the amount obtained by dividing the total output value of agriculture and forestry by the number of employed persons. From this amount, salaries are paid, and fertilizers, pesticides, materials, machinery, and other items are purchased. The remaining funds go toward income and future investments.
In other words, an increase in sales per person leads to higher individual income for farmers, the development of their businesses, and ultimately the growth of agriculture as a whole. In Japan’s agriculture and forestry sector, this figure has been trending upward over the long term.
In lectures for farmers, I sometimes ask, “Has anyone seen their sales per person drop over the past 10 years?” but no one raises their hand.
6.29 million yen is merely a national average. While there are people with less, there are also many who generate tens of millions of yen in sales per person.
7. Number of Employed Persons Down by About 90%, Output Value Up About 6-Fold—What the “Agricultural Decline Theory” Overlooks
The sales per person shown earlier is calculated from the number of people employed in agriculture and forestry (see graph in 1.) and the agricultural and forestry output value. So, how have those two figures changed over the long term?
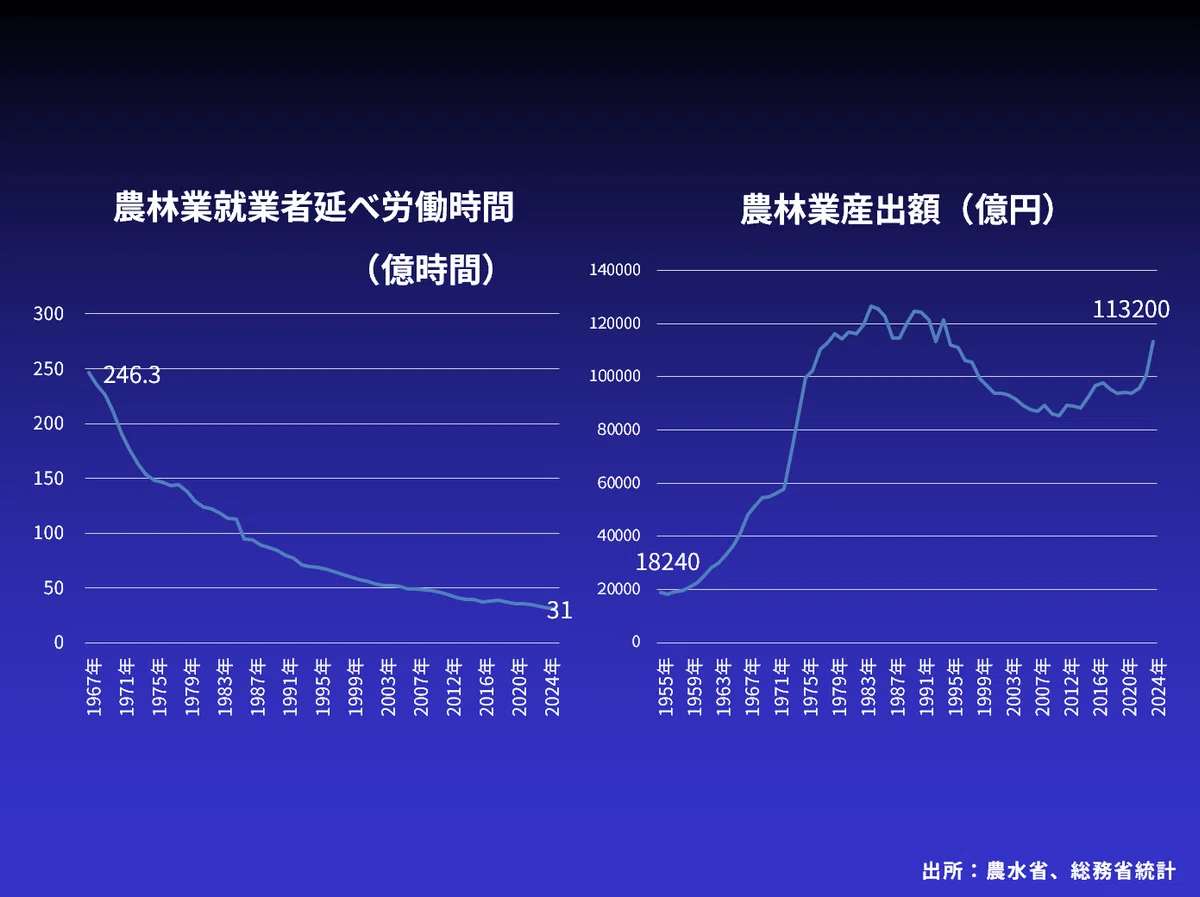
The number of people employed in agriculture and forestry decreased from 14.87 million in 1953 to 1.74 million in 2024, a decline of about 90%. Meanwhile, the agricultural and forestry output value increased from 1.8855 trillion yen in 1955 to 11.32 trillion yen in 2024, an increase of about 6-fold in nominal terms.
Output value increased to the 12 trillion yen range in the 1980s before turning downward. There were periods in the late 2000s and early 2010s when it fell below 9 trillion yen, but it has since recovered, exceeding 11 trillion yen again in 2024.
In past discussions surrounding agriculture, people would look only at the decline in the number of workers and say, “It’s a crisis because the number of people supporting agriculture has plummeted,” and would cite the decrease in output value from its peak in the 1980s to conclude that “agriculture is shrinking.”
By placing the two figures of the decline in the number of farm households and the decline in output value side-by-side, the impression that “agriculture is in decline” has been created.
However, when you combine these two statistics, a different picture emerges. While the number of employed persons has decreased significantly, the total output value of agriculture and forestry has increased over the long term.
To judge the development of an industry, it is necessary not only to look at the number of employees or output value individually but also to convert them to a per-person basis to see changes in productivity.
The long-term statistics of Japanese agriculture demonstrate exactly that importance.
8. Sales per hour of labor have increased from 195 yen to 3,560 yen
Next, we will look at sales per hour of agricultural work.
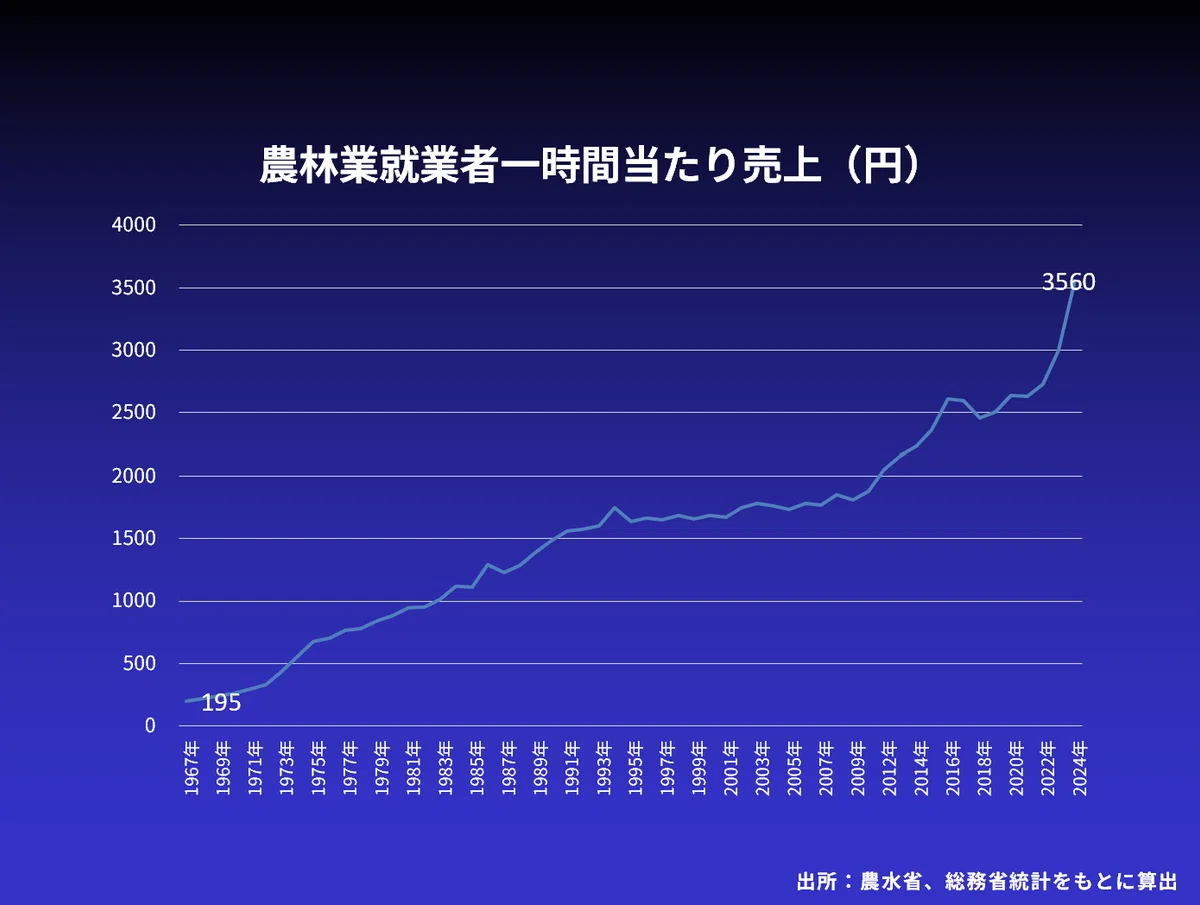
Next, we will look at sales per hour per person engaged in agriculture and forestry. We use the total labor hours and output value of the entire agriculture and forestry sector for the calculation.
The total labor hours of those engaged in agriculture and forestry decreased from 24.63 billion hours in 1967 to approximately 3.1 billion hours in 2024. On the other hand, the output value of agriculture and forestry has been increasing over the long term.
By dividing the agriculture and forestry output value by the total labor hours, we can calculate the sales per hour.
As a result, it increased from 195 yen in 1967 to 3,560 yen in 2024, an approximately 18-fold increase. Although this is a comparison based on nominal amounts, the long-term growth is clearly visible in the graph as well.
Now, is the current sales figure of 3,560 yen a sufficient level for agricultural profitability?
Assuming that 30% of sales becomes income, that is approximately 1,070 yen per hour. This is the reality of the average profitability of Japan’s entire agriculture and forestry sector.
On the other hand, while the national average for sales per hour is just under 4,000 yen, there are some agricultural corporations that exceed tens of thousands of yen. In such businesses, the average annual income of employees has reached a level exceeding 5 million yen.
The labor productivity of Japanese agriculture has improved significantly over the long term. Furthermore, there is room for individual businesses to increase productivity and income.
9. How to count the agricultural population—The pitfall of MAFF statistics
To correctly evaluate agricultural productivity, it is necessary to grasp how many people are actually working and how much time they spend on production. If the method of counting the number of people differs, the production volume and sales per person will also change.
Therefore, in this analysis, we use the Ministry of Internal Affairs and Communications’ “Labor Force Survey” rather than the Ministry of Agriculture, Forestry and Fisheries’ (MAFF) employment data.
The “core agricultural workers” emphasized by MAFF mainly target those engaged in self-employed farming and do not sufficiently capture those employed by agricultural corporations and the like. On the other hand, statistics based on the household unit of “farm households” may include people who are hardly engaged in agriculture at all.
If you exclude employees or include people who are not actually working when counting those working in agriculture, you cannot see the reality of productivity. If you overcount the number of people, sales per person will be low, and if you undercount, they will be high.
Despite being the ministry that specializes in agriculture, statistics that can grasp the entire agricultural workforce, including employees, under a unified standard over the long term are not sufficiently developed. MAFF’s agricultural population statistics have a serious flaw in evaluating the productivity of the entire industry.
For this reason, the graphs in this article are labeled “Source: MAFF, Ministry of Internal Affairs and Communications.” We use MAFF data for production volume and output value, and for long-term time-series production volume, we also utilize data from the Food and Agriculture Organization of the United Nations (FAO), which is easy to obtain. We use data from the Ministry of Internal Affairs and Communications for the number of workers and labor hours.
In international comparisons, what is important is to count workers in each country using the same criteria. If only Japan includes people with the attribute of being a “farm household” broadly, while other countries count those who are actually working, a comparison cannot be made.
The agricultural population has decreased, and farmers’ incomes are low, therefore Japanese agriculture is in decline. If the definition of the number of people, which is the starting point of such arguments, remains ambiguous, the conclusions will also be distorted.
The number of farm households, the number of core agricultural workers, and the number of employed persons including employees. These are statistics that count different subjects. Nevertheless, without explaining those differences, people pick out only convenient numbers to talk about the decline of agriculture. That is not an analysis of the reality, but an impression manipulation using statistics.
What should be questioned is not how many people are counted as farmers. It is how many people are actually working, for how many hours, and how much production and sales they are generating. It is from those figures that we can verify the development of Japanese agriculture.
10. Japanese Agriculture Has Reduced Working Hours and Increased Productivity
There is also an image of agriculture as “working long hours but not earning anything at all.”
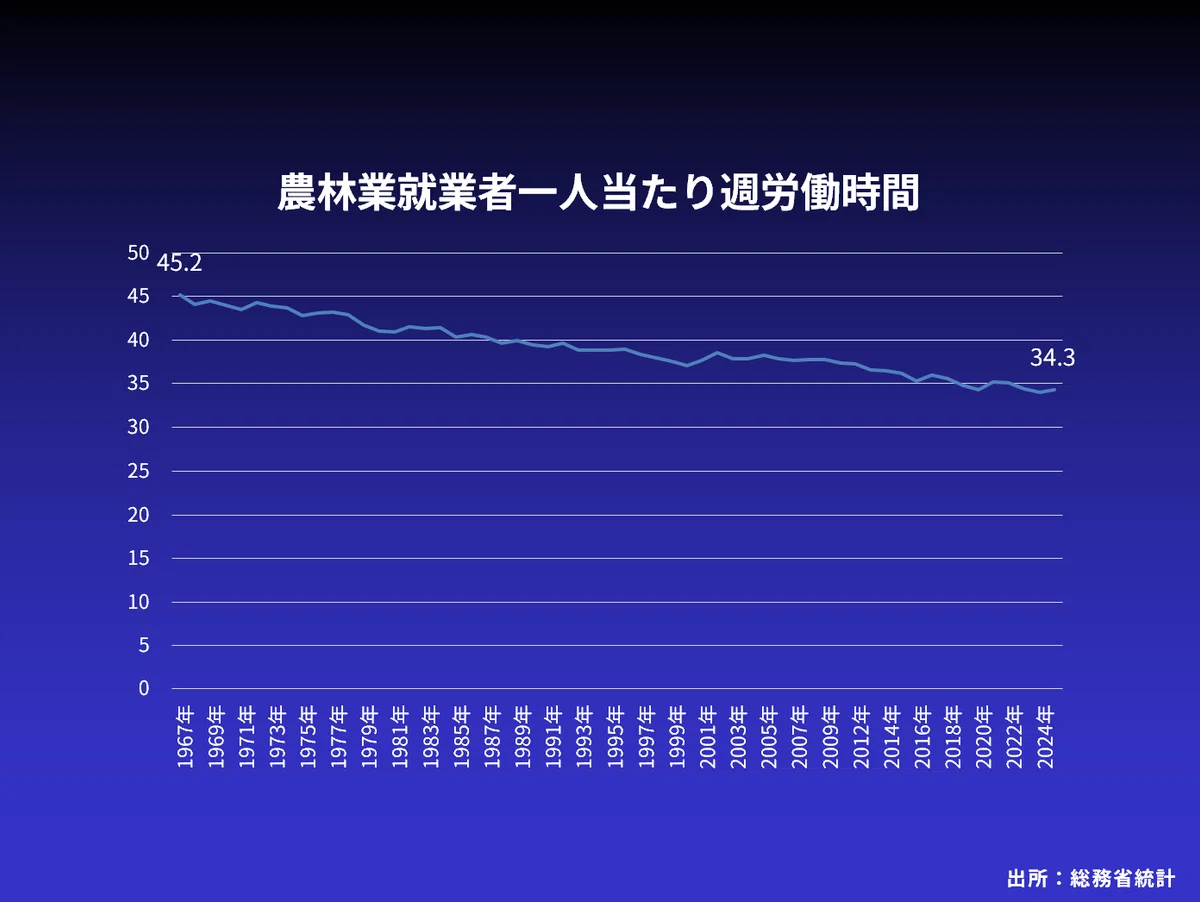
Looking at the weekly working hours per agricultural and forestry worker based on the Ministry of Internal Affairs and Communications’ “Labor Force Survey,” it has decreased by about 11 hours from 45.2 hours in 1967 to 34.3 hours in 2024. In the long term, working hours in agriculture have also been shortening.
Of course, there is a range in individual ways of working. Some people work about 10 hours a week, while others work 60 hours. Even so, the average working hours have decreased over the long term and are now at a level close to that of general industries.
Agriculture also has seasonality. Working hours become longer during busy farming seasons such as harvest time, and shorter during off-seasons. The practice of adjusting annual working hours by combining busy periods with relatively relaxed periods has been done for a long time.
The important thing is that while working hours have decreased, production and sales per person and per hour have increased.
The growth of Japanese agriculture did not happen suddenly at any one point.
Introducing new machinery. Changing work procedures. Improving the use of pesticides and fertilizers. Introducing varieties with superior yields and quality. The technological innovation and management improvements accumulated in the field of agriculture are reflected in the figures as improvements in productivity.
Looking only at the number of workers, Japanese agriculture appears to have shrunk significantly. However, the long-term statistics we have looked at show a different picture.
The number of agricultural and forestry workers has decreased by about 90%, and the total working hours have also decreased to about one-eighth. Even so, the production volume of agricultural and forestry products has maintained about 70%. The annual production per person has increased about fivefold, and the production per hour of labor has also increased more than fivefold.
Sales are the same. Annual sales per person increased from 130,000 yen in 1955 to 6.29 million yen in 2024, and sales per hour also increased from 195 yen in 1967 to 3,560 yen in 2024.
We have become able to produce more agricultural products with fewer people and in shorter time. This is the development of Japanese agriculture seen from long-term statistics.
Arguments that directly link the decrease in farmers to decline cannot capture this change. In the field of agriculture, mechanization, technological innovation, and management improvement have been continued for decades.
Japanese agriculture has not been in decline. While reducing the number of workers, it has increased productivity and steadily developed.
※ This article is edited and reconstructed for note based on the content of the video released on Yoshihiro Asakawa’s YouTube channel “The Depths of the World”.
▶︎ Yoshihiro Asakawa Books
“Japan is the World’s 5th Largest Agricultural Power,” “Trump’s Black Persuasion Techniques,” “Cairo University,” and others. Yoshihiro Asakawa’s books are here