
Metals markets remain in a delicate tug-of-war, with structural deficits and massive AI-driven data center infrastructure buildout providing forward momentum, while global growth reassessments, high energy prices and the growing risk of interest rate increases increasingly challenge the bullish thesis.
Base metals prices have been highly volatile so far in the current year, with the LMEX hitting an all-time high in early June before plunging to a 3-month low a couple of weeks later after the collapse of the ceasefire deal between the U.S. and Iran triggered a surge in oil prices and stoked fresh global inflation fears. Leveraged investors are increasingly selling assets to raise cash as they expect central banks to keep interest rates higher for longer to fight inflation.
Meanwhile, metal-specific tariff uncertainty remains a key driver of volatility and inventory dislocations. Commodity analysts at Standard Chartered have issued the medium-term outlook for various base metals, saying that prices are likely to take their cue from macro dynamics, including shifts in risk appetite, Fed rate policy, US dollar moves and China economic activity.
#1. Copper
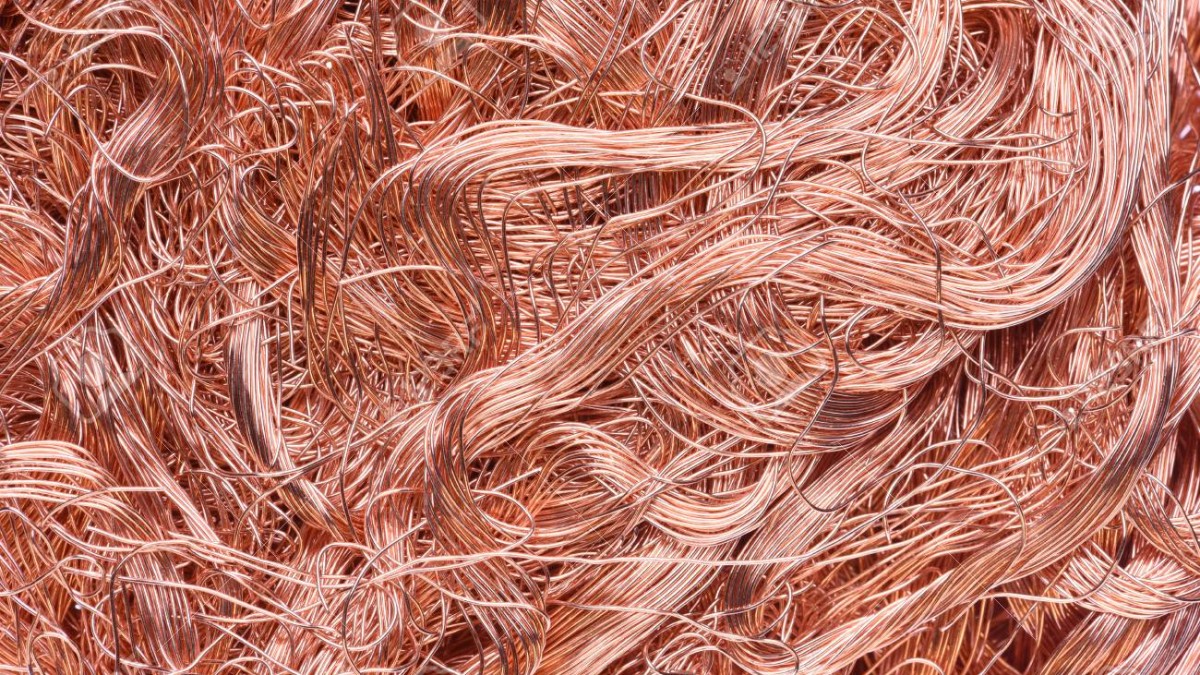
LME copper prices have largely remained range-bound over the past two months, trading sideways in a $13,000-14,000/t range after testing the $14,000/t all-time high in May.
StanChart has forecast that copper prices will remain elevated in H2 given U.S. copper tariff review uncertainty, inventory dislocations (with inflows to the US incentivized by the Comex-LME premium), supply underperformance and recent China demand signals.
While China’s economic growth in the second quarter clocked in at 4.3% Y/Y, below the target range of 4.5-5.0%, StanChart says there are several supportive signals from China for copper demand. These include declining SHFE copper inventories, indicating tighter domestic supplies; a pickup in refined copper imports (with unwrought copper imports reaching 478 kt in June, up 4% year over year), suggesting stronger buying activity; and continued strength in the Yangshan copper import premium, a sign that Chinese buyers are willing to pay more for imported copper due to robust demand.
StanChart is hardly the only copper bull. In its latest Global Critical Minerals Outlook, the International Energy Agency (IEA) warns that the short- and medium-term copper supply has “worsened considerably”, driven by severe disruptions in sulphuric acid availability due to the Iran war (essential for copper processing), geopolitical conflicts in the Middle East and slower-than-expected recoveries at major mines.
The IEA says that even as supply stutters, copper demand continues to surge due to grid expansions, renewable energy transitions and skyrocketing power requirements from artificial intelligence (AI) data centers.
#2. Aluminum
Aluminium prices have been driven by geopolitical headlines around the Middle East conflict, with the region accounting for 9% of global production.
Initially, headline LME prices were slow to reflect the supply risk compared with the rise in regional physical premiums; however, prices went on to hit four-year highs, peaking in early June at over $3,700/t. Prices have retreated since then, dropping to their lowest close since 19 February on 1 July, completely erasing the geopolitical premium.
According to StanChart, the sell-off was slightly overdone because the return of more than 3 million tonnes of aluminium production that has been idled by output curtailments and smelter damage is unlikely to happen all at once. With different facilities expected to resume production on different timelines, supply constraints could persist longer than the market is currently pricing in.
As StanChart notes, robust production in Asia has been a key reason for the subdued price response to supply risk from the Middle East smelters. Indonesia’s aluminium output growth has been strong while China’s domestic output is testing the 45Mt production cap with producers looking to take advantage of higher prices and improved margins. China’s unwrought aluminium and product exports hit an all-time high of 711kt in June, good for 45% Y/Y after rising m/m for four consecutive months. Stanchart has lowered its aluminum price forecast to an average of $3,318/t in 2026, down from $3,478/t previously.
#3. Platinum Group Metals
Alongside the rest of the Platinum Group Metal complex, the platinum market is still searching for a floor.
However, StanChart has maintained a positive outlook thanks to several positive catalysts. This includes the gold price downturn as markets price in rising real yields and a stronger US dollar, hefty outflows across ETPs (Exchange-Traded Products), speculative positioning scaling back rapidly, market pricing in sharper downgrades in auto production and sales of internal combustion engines as well as growing scope for increased recycled supply.
Palladium fell to a low of $1,200/oz in June as prices across the platinum group metals continued to weaken. StanChart remains the least optimistic on palladium among the precious metals, warning that a weaker economic outlook could further reduce demand. Investor sentiment has also deteriorated, with speculative funds increasing their bearish bets during the second quarter. Trading activity has slowed while inventories have continued to rise, a sign that demand has not been strong enough to absorb available supply. Exchange stocks climbed to 200 koz, approaching Nymex inventories of 233 koz. Reflecting those weaker fundamentals, StanChart has lowered its 2026 average palladium price forecast to $1,454/oz from $1,850/oz previously.
Meanwhile, StanChart has predicted that the rhodium market will remain modestly undersupplied in the current year and close to balance in 2027. Key drivers for the rhodium market are the pace of decline for auto-catalyst demand as well as the scope for a recovery in recycling.
The fact that rhodium has also been under pressure suggests that there is a slowdown in auto expectations. However, lower prices are also more attractive for hedging activity. StanChart expects rhodium prices to average $9,268/oz in 2026, down from the previous forecast at 9,563/oz.
By Alex Kimani for Oilprice.com