


Key points of this article
・A day when Nikkei 225 option trading volume suddenly increases is a day when people betting on ‘up’ or ‘down’ have gathered all at once.
・However, trading volume alone cannot tell whether this is the beginning of a trend or the end of an overextension.
・Therefore, when we combined this with how far the Nikkei Stock Average was from its 25-day moving average on that day (the deviation rate), the results were clearly divided.
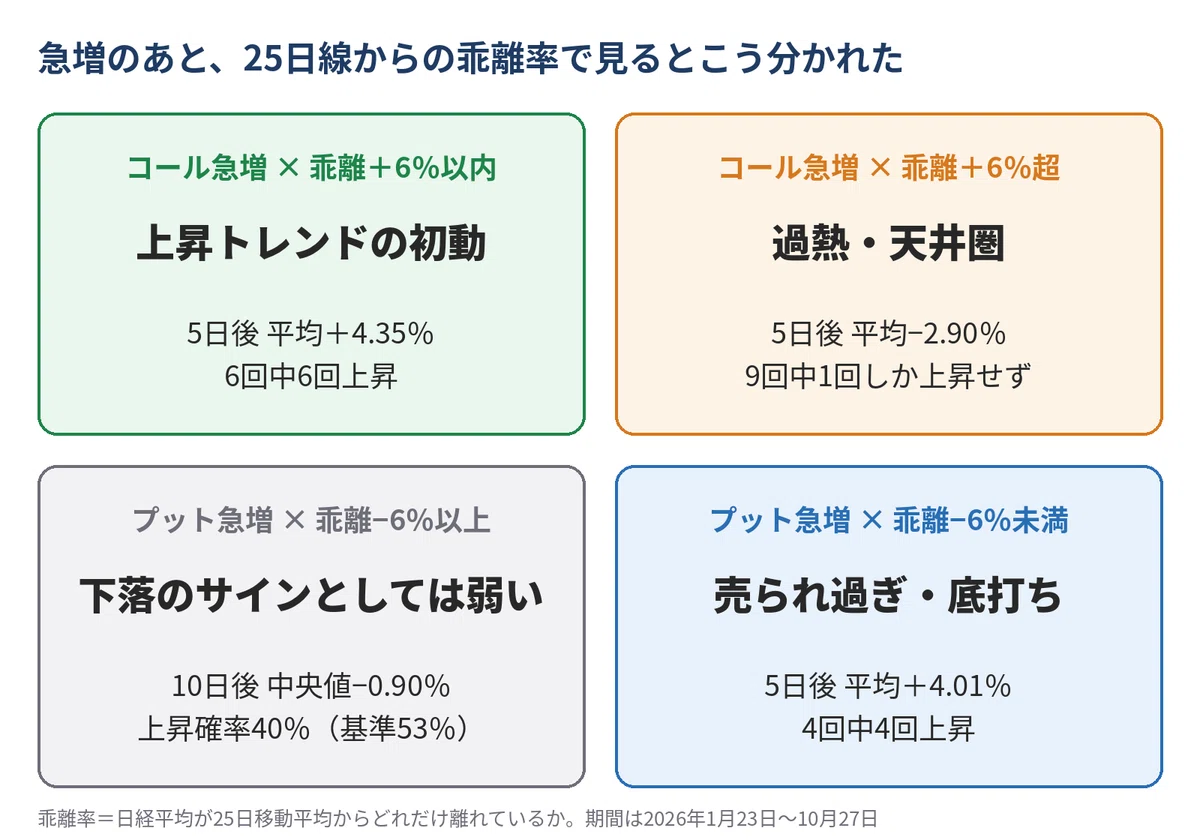
・On a day when call volume surges, if the deviation rate is within +6%, it tends to be the initial move of an uptrend; if it exceeds +6%, it tends to be in the ceiling range.
・On a day when put volume surges, if the deviation rate is less than -6%, it is oversold and tends to be a bottoming out.
*This is a verification over approximately 9 months from January 23 to October 27, 2026. Since the number of cases is small, please view this as a guideline.
First, the meaning of the terms
Options, calls, and puts
Nikkei 225 options are transactions that buy and sell the ‘right to buy (or sell) the Nikkei Stock Average at this price in the future.’
・Call: The right to buy. Bought by people who think the Nikkei Stock Average will rise.
・Put: The right to sell. Bought by people who think the Nikkei Stock Average will fall. Often bought as ‘insurance’ to prepare for a decline in the value of stocks held.
‘Surge’ in trading volume
The total amount of money traded on a given day is called the trading volume. Here, a ‘surge’ is defined as a day when the trading volume for that day became 1.5 times or more of the median (middle value) of the past 20 business days.
A surge in calls means that bets on ‘rising’ have gathered all at once, while a surge in puts means that bets on ‘falling’ or purchases of insurance have gathered all at once.
25-day moving average and deviation rate
The 25-day moving average is the average of the closing prices of the past 25 business days. Please think of this as the ‘average price’ over the last month or so.
The deviation rate is a percentage representing how far the current Nikkei Stock Average is from that average. If it is +, it is above the average; if it is -, it is below the average. The further away it is, the more it indicates that it has risen (or fallen) suddenly in a short period.
Results: Only the deviation rate was effective
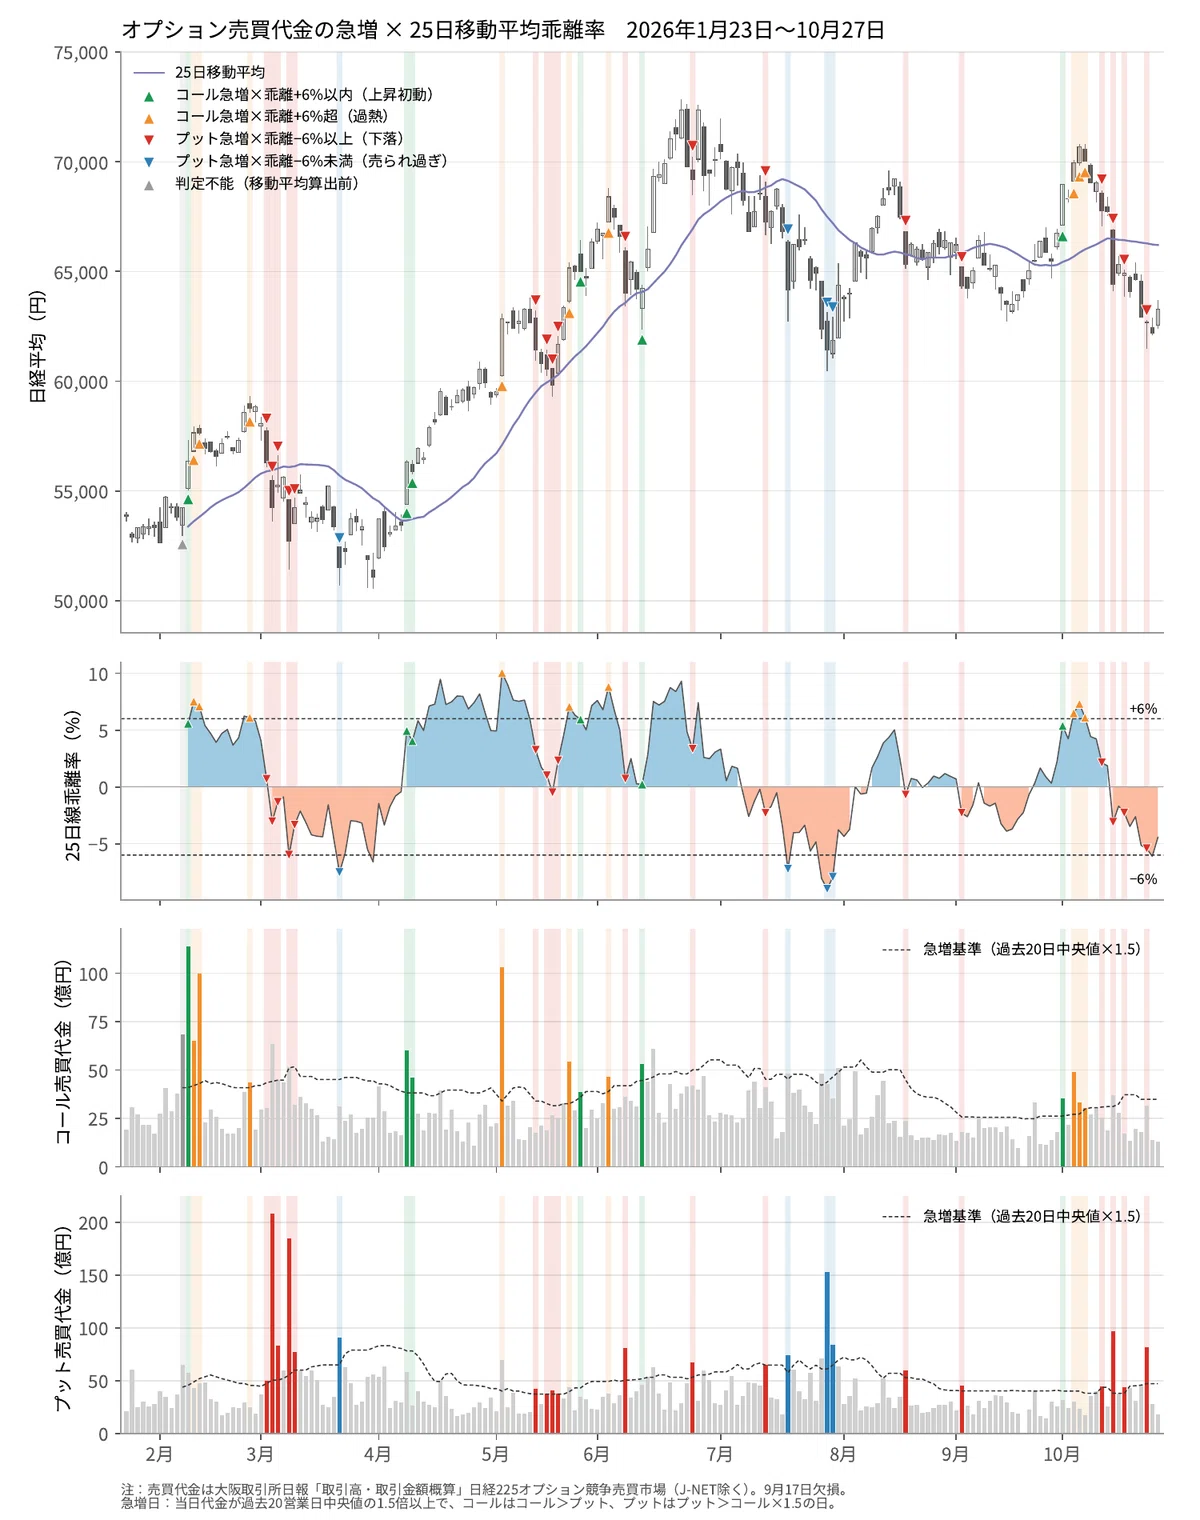
After trying several combinations, the most useful metric for distinguishing trends was the deviation rate from the 25-day line.
How far the stock price is from the average at the time the surge occurs. Depending on that, it was clearly divided into the ‘initial move of a trend’ or the ‘end point of an overextension.’
Call surge × Deviation within +6%: Initial move of an uptrend
・The 5-day average is +4.35%, and it rose 6 out of 6 times
・The 10-day average is +3.62%
Call surge × Deviation > +6%: Overheated/Top range
・The 5-day average is -2.90%, and it rose only 1 out of 9 times
・The 10-day average is -3.54%
Put surge × Deviation
・The 5-day average is +4.01%, and it rose 4 out of 4 times
・The 10-day average is +6.33%
Put surge × Deviation ≥ -6%: Weak as a signal for a decline
・The 10-day median is -0.90%, with a 40% probability of rising
・Although lower than the probability of rising when looking at all business days (53%), it is not a clear difference
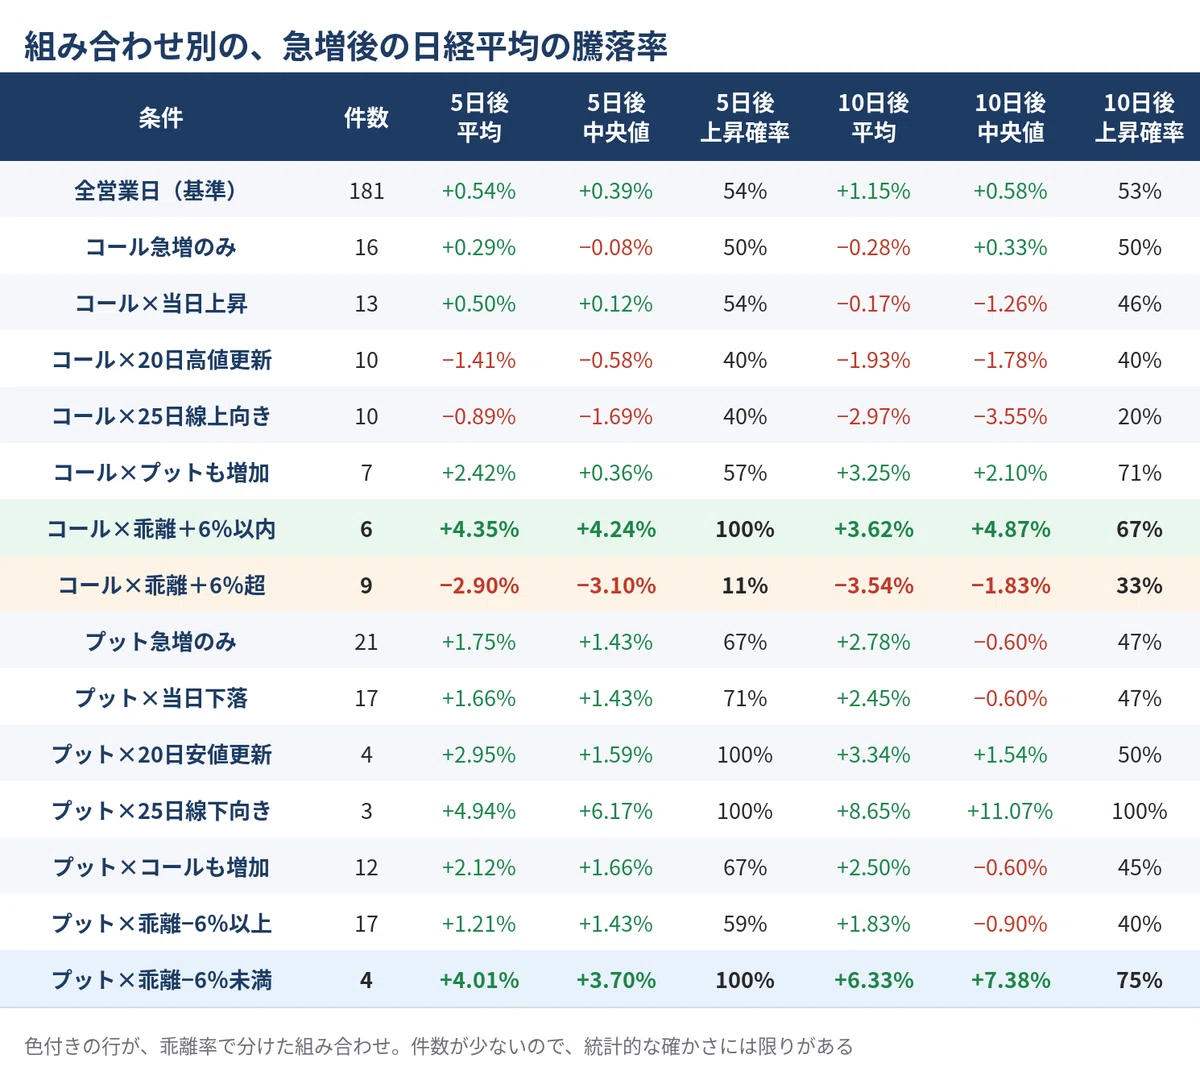
The ‘All business days (benchmark)’ in the table above shows how much the market moved on average starting from any given day, regardless of a surge. Combinations that differ significantly from this are considered meaningful.
Why can it be distinguished by the deviation rate?
A surge in trading volume indicates that ‘bets in one direction have gathered all at once.’ However, trading volume alone cannot tell whether that is the beginning or the end of a trend. This is why, in the previous verification, the market continued to move in the same direction after a surge only about half the time.
A call surge near the average is an ‘entry point’
A call surge when the stock price is still near the moving average (within +6% deviation) means that new buyers have entered at the stage where the price has just started to rise. Since there are still buyers left, the rise is likely to continue.
Example: April 8th and 9th. Immediately after breaking above the 25-day moving average, it rose +11-13% over the next 20 days.
A call surge after moving far from the average is an ‘exit point’
A call surge after the stock price has moved far from the average (over +6% deviation) is a state where latecomers’ buying has gathered at the very end. Since there are not many buyers left, it becomes difficult for the price to rise further.
Example: February 26th, June 3rd, and October 5th-7th. The 70,684 yen on October 6th was the high based on closing prices during this period.
A put surge after a significant sell-off is a ‘bottom’
A put surge with a deviation of less than -6% is a phase where insurance buying and panic selling have been exhausted. Since there are no sellers left, it is easy for the price to rebound.
Example: March 23rd, July 17th, and July 29th-30th. The 61,434 yen on July 29th became the low, and it rose +12.7% to 69,220 yen on August 17th.
Ineffective combinations
Whether it went up or down that day
A surge in calls usually occurs on days when the market rises, and a surge in puts usually occurs on days when it falls. Therefore, combining them does not provide new clues.
20-day high update and 25-day moving average trending upward
When combined with a surge in calls, the performance actually worsened (the 10-day average was -1.93% and -2.97%). This is because it picks up on a situation where the rise has already progressed.
Days when the opposite side also increased simultaneously
If puts also increased on a day when calls surged, the 10-day performance was good at +3.25%. However, there were only 7 such cases, and the difference was not as clear as with the deviation rate.
Put surge × Deviation of -6% or more
Early March actually overlapped with a phase of decline. On the other hand, May 15–21 and June 8 were temporary declines (pullbacks) in the middle of an uptrend, followed by a significant rise. Since the period this time was a bull market, it can be said that it was difficult to obtain a signal indicating that ‘the decline will continue’.
How to use
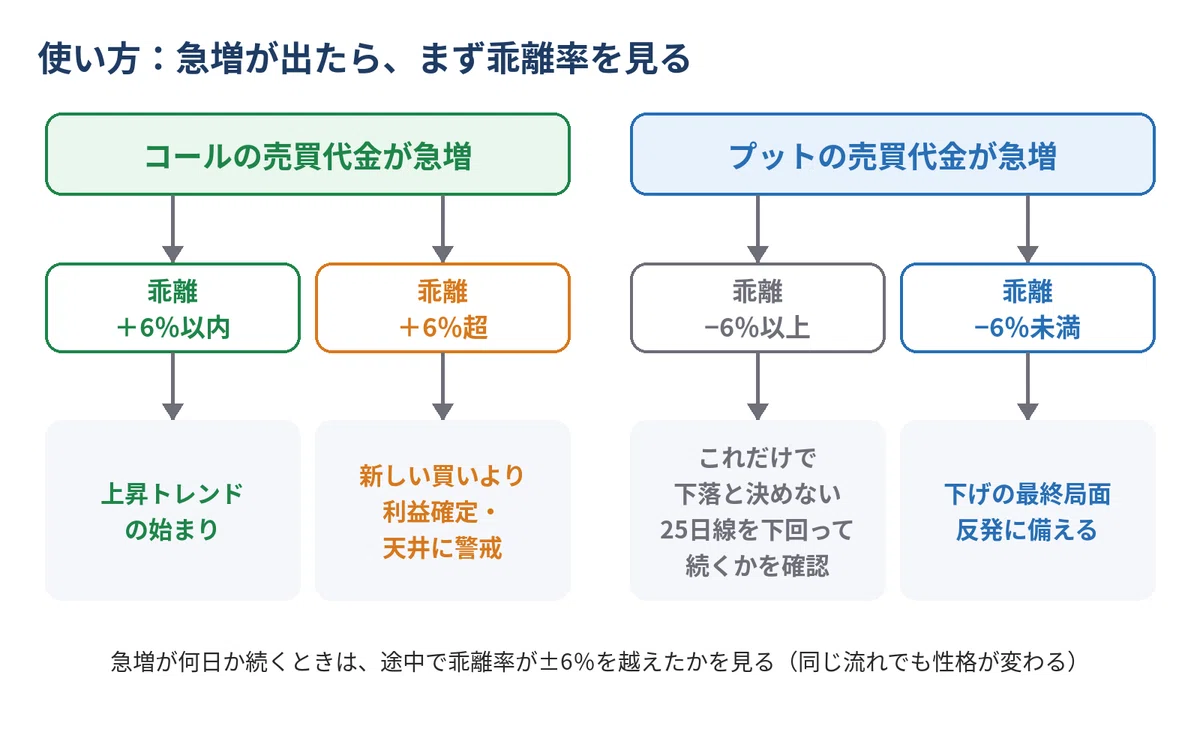
If calls surge
First, check the deviation rate from the 25-day moving average. ・Within +6%: High probability of the start or continuation of an uptrend. ・Over +6%: Prioritize profit-taking or caution regarding a market top over new purchases.
If puts surge
・Less than -6%: View it as the final phase of a decline and prepare for a rebound. ・-6% or more: Do not decide it is a decline based on this alone; also check if it continues to trade clearly below the 25-day moving average.
When a surge continues for several days
While it is continuing, check whether the deviation rate has exceeded ±6%. This is because the nature of the trend can change even within the same flow. ・February 9 (deviation +5.6%, initial move) → February 10 and later (over +7%, overheating). ・October 1 (+5.4%) → October 5–7 (over +6%).
Points to keep in mind
・The period verified is approximately 9 months (184 business days), which includes a strong market where the Nikkei 225 rose from the 51,000 yen range to the 72,000 yen range. ・The number of days with surges is small, ranging from 3 to 21 cases per condition, so there is a limit to statistical certainty. ・The ±6% line is a guideline based on the dispersion of the deviation rate during this period (standard deviation of 4.6%). If the market volatility changes, the appropriate level will also change. ・Nikkei VI (an index representing the expected magnitude of Nikkei 225 price movements), open interest (the amount of trades remaining without being settled), and futures trading patterns were not investigated this time.
Source: Osaka Exchange ‘Osaka Exchange Daily Report: Estimated Trading Volume and Value’ (Nikkei 225 options, by put/call, competitive trading market, excluding J-NET); Nikkei 225 is from Yahoo! Finance. Data for September 17 is missing because the daily report format is different.