


If you’re looking for long-term investment gains, growth stocks aren’t the only game in town. Recent market forecasts from Vanguard say U.S. value stocks (companies rated as undervalued compared to their fundamentals) might outperform U.S. growth stocks over the next 10 years.
Two popular Vanguard exchange-traded funds (ETFs) offer slightly different approaches to investing in value stocks. The Vanguard Small-Cap Value ETF (VBR +0.40%) is passively managed, low-cost, and tracks an index of small companies. The Vanguard U.S. Value Factor ETF (VFVA 0.05%) is an actively managed fund in which — for a slightly higher fee — professional investment managers choose a mix of undervalued stocks to include in the portfolio.
Both of these value ETFs have outperformed the S&P 500 index and the tech-heavy Nasdaq-100 in the past year.
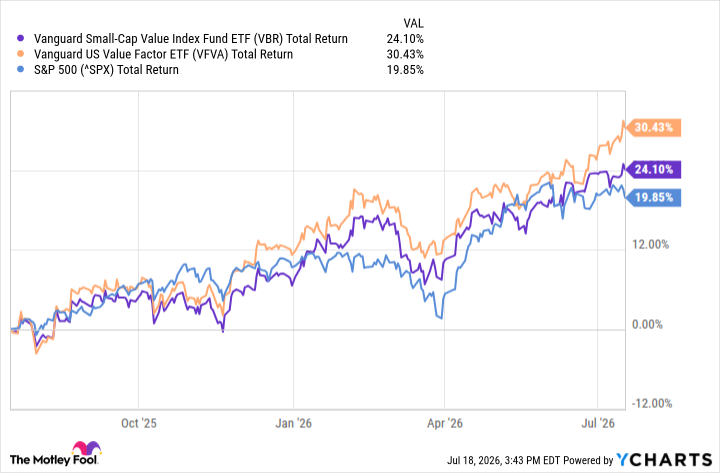
VBR Total Return Level data by YCharts
Could value stocks keep beating the market? And if so, are these the right value ETFs to buy? Let’s take a closer look at these Vanguard ETFs.

Image source: Getty Images.
Vanguard Small-Cap Value ETF (VBR): 840 stocks, 22 years of 9.5% annualized returns
Vanguard’s latest research is not just bullish on value stocks — the company’s research team also forecasts small-cap stocks will outperform large caps. If you want to follow that general investment strategy, the Vanguard Small-Cap Value ETF might be a good choice. This ETF combines small-cap and value investing in one fund.
The Vanguard Small-Cap Value ETF holds 840 stocks. Since the fund’s inception in January 2004, this ETF has delivered average annual returns (by net asset value) of 9.51%. More recently, it’s delivered annualized returns of about 27% over the past year, 16.1% over the past three years, and 9.2% over the past five years.

Vanguard Small-Cap Value ETF
Today’s Change
(0.40%) $0.97
Current Price
$243.14
Key Data Points
AUM
$68B
Dividend Yield
1.78%
Expense Ratio
0.05%
Top Holdings
JBL
0.87%
NRG
0.66%
TPR
0.63%
This small-cap stock ETF is broadly diversified across sectors. Its top five sector holdings are industrials (20.8% of the fund), financials (18.1%), consumer discretionary (14.6%), real estate (10.2%), and technology (8.5%). The fund has achieved 5.2% average annual earnings growth for the past five years and has a trailing 12-month price-to-earnings (P/E) ratio of about 18. It charges an ultra-low expense ratio of 0.05%.
Vanguard U.S. Value Factor ETF (VFVA): 666 stocks, eight years of 10.96% average annual returns
If you don’t want to invest in only small-cap stocks and don’t mind paying a higher fee, the Vanguard U.S. Value Factor ETF could be worth a look. This actively managed fund holds 666 stocks of companies of all sizes (large-, mid-, and small-cap), based on such factors as book value/price, forward earnings/price, and operating cash flows/price. It charges an expense ratio of 0.13%.
This ETF has been in existence since February 2018. During that eight-year time frame, the Vanguard U.S. Value Factor ETF has delivered annualized returns of 10.96%. It’s done even better more recently, with average annual returns of about 16.9% over the past three years.

Vanguard Wellington Fund – Vanguard U.s. Value Factor ETF
Today’s Change
(-0.05%) $-0.08
Current Price
$153.38
Key Data Points
AUM
$845M
Dividend Yield
1.82%
Expense Ratio
0.13%
Top Holdings
EOG
1.05%
T
0.99%
BMY
0.99%
Because it invests in larger companies, not just small caps, the top holdings in the Vanguard U.S. Value Factor ETF are names that many everyday investors might know. The top stocks in the fund include energy stock EOG Resources (0.84% of the fund), healthcare stocks Bristol Myers Squibb (0.83%), and Cigna Group (0.78%), and tech stocks Salesforce (0.80%) and Intuit (0.76%).
Compared to the small-cap fund, the Vanguard U.S. Value Factor ETF has delivered faster earnings growth and might be cheaper. The VFVA fund has achieved 7.1% average annual earnings growth over the past five years and a P/E ratio of 11.4. And since VFVA’s inception, it has outperformed the Vanguard Small-Cap Value ETF (although both funds have underperformed the S&P 500 index).
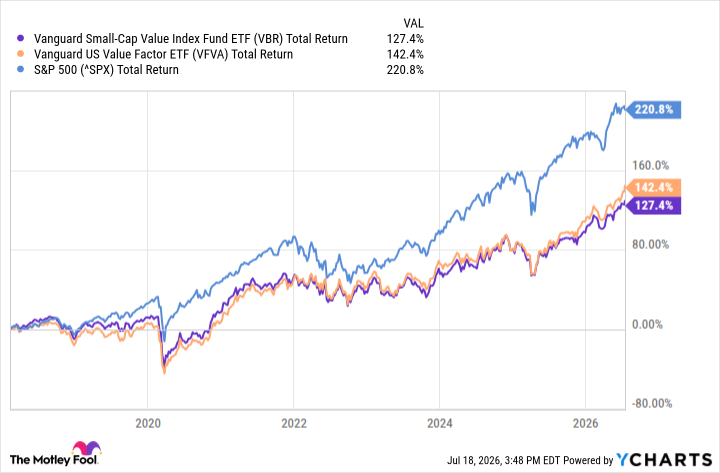
VBR Total Return Level data by YCharts
Why buy VBR or VFVA — or other value stock ETFs
There’s no guarantee that Vanguard’s research predictions will be correct. Large caps and growth stocks might have a resurgence. Value stocks might go sideways. But if you believe that value stocks are poised to keep beating the market, both of these value ETFs might be worth considering. Or you could look at some of the other best value ETFs.