


When you look at gold charts every day, it is easy to think that silver and platinum will move in roughly the same way because they are all ‘precious metals.’ In fact, the risk limit rules of the prop firm I use group gold, silver, platinum, and palladium together into the same ‘precious metals’ category.
On the other hand, when you look at the details, the three metals differ significantly in terms of ‘who is buying them and why.’ In this article, I will organize the differences between gold, silver, and platinum based on official statistics, and finally, I will write about how I treat these three within my own rules.
Note that my verification has been conducted using gold and major currencies, and I have not yet verified silver and platinum. Please read this article as study notes.
First, the conclusion: They are similar in ‘how prices are determined,’ but different in ‘the nature of their demand.’
Here is the big picture first.
-
Similarities: All are primarily traded in US dollars and are influenced by movements in the dollar, interest rates, and the inflow and outflow of investment money into precious metals as a whole.
-
Differences: Gold is centered on investment, jewelry, and central banks; silver is more than half industrial; and platinum has a large share in automotive exhaust catalysts and industrial use.
It is easier to organize your thoughts by considering that they are put in the same group for the former reason, but should be viewed as distinct for the latter reason.
Gold: A ‘metal close to money’ supported by investment and central banks
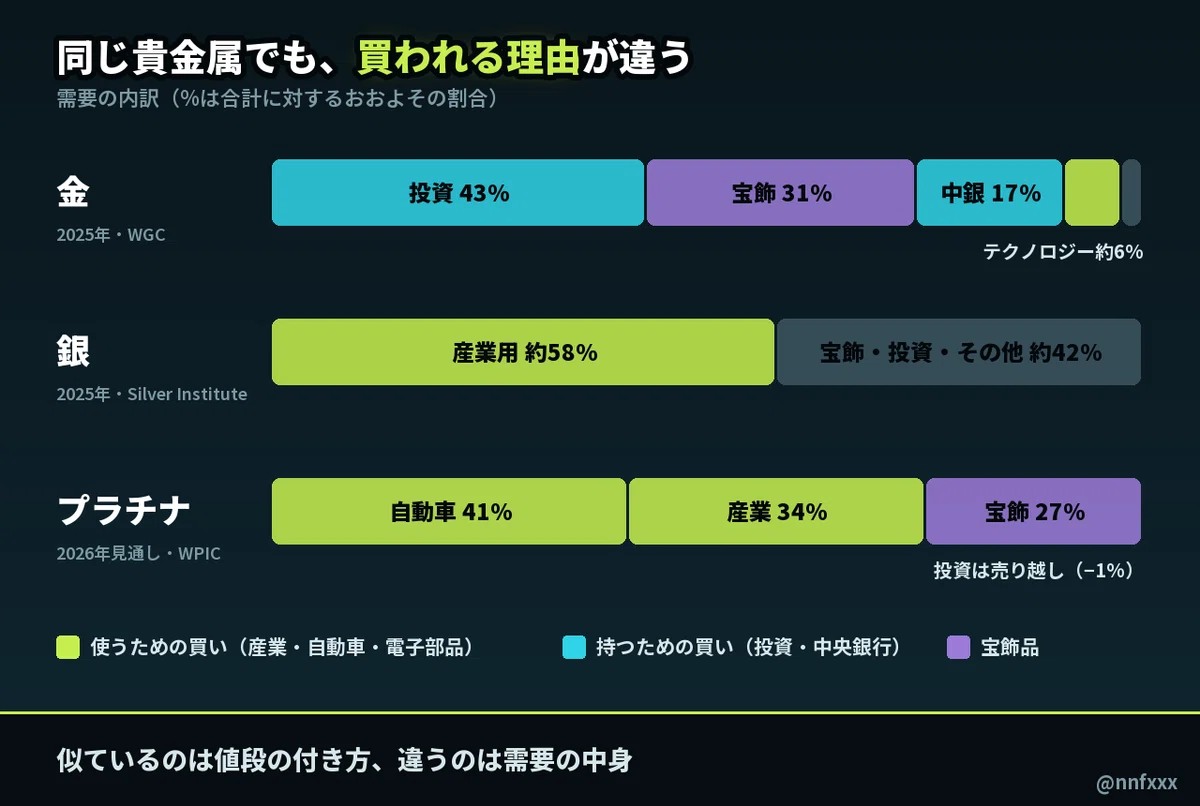
According to 2025 statistics published by the World Gold Council (WGC) in January 2026, total gold demand was 5,002 tons, a record high. The main breakdown is as follows.
-
Investment (bullion, coins, ETFs, etc.): 2,175 tons (approx. 43% of the total)
-
Jewelry: 1,542 tons (approx. 31%)
-
Central bank purchases: 863 tons (approx. 17%)
-
Technology (electronic components, etc.): 323 tons (approx. 6%)
Industrial use does not even reach 10%. The majority of gold demand is buying ‘to hold.’ That is why it is generally said to be easily moved by factors related to money itself, such as real interest rates, the strength of the dollar, emergencies, and the actions of central banks.
In 2025, while the volume of jewelry decreased by 18% from the previous year, investment increased significantly. The pattern is that when prices rise, jewelry buying decreases and investment buying increases.
Silver: More than half is ‘industrial material’
Although silver is a precious metal like gold, it is a metal with a significant face as a material for industrial products.
According to the ‘World Silver Survey 2026’ published by the Silver Institute in April 2026, total silver demand in 2025 was approximately 1.13 billion ounces, of which 657.4 million ounces were for industrial use. Approximately 58% of the total is for industrial use. Its uses are diverse, including electrical and electronic components, solar panels, and soldering.
There are also characteristics in terms of supply. Silver is a metal produced in large quantities as a ‘by-product’ that emerges when mining lead, zinc, copper, and other metals. Even in the same statistics, lead and zinc mines are considered the largest sources of supply. Just because the price of silver rises does not necessarily mean that the production of silver alone can be increased immediately.
In summary, silver moves based on both ‘investment buying as a precious metal’ and ‘industrial buying influenced by the economy.’ While it often moves in the same direction as gold, it is generally said that there are times when it moves differently from gold in situations where the economic outlook changes.
Gold-Silver Ratio
The gold-silver ratio, which represents ‘how many times the price of gold is compared to the price of silver,’ is often used when looking at the relationship between gold and silver. This ratio is not constant. It exceeded 120 times at one point during the sharp decline in March 2020, and it also exceeded 100 times in April 2025. It is reported to be around 75 times as of the end of October 2026.
The fact that the ratio fluctuates this much means that gold and silver are not moving by the ‘same amount.’ It is also said that silver tends to have a wider range of price fluctuations than gold.
Platinum: Automobiles, industry, and supply concentration
The core of platinum demand is catalysts that purify automobile exhaust gases.
According to the outlook published by the World Platinum Investment Council (WPIC) in September 2026, total platinum demand for 2026 is projected to be 7,089 thousand ounces.
-
Automobiles: 2,904 thousand ounces (approx. 41%)
-
Industry (chemicals, glass, electronics, medical, petroleum, etc.): 2,385 thousand ounces (approx. 34%)
-
Jewelry: 1,883 thousand ounces (approx. 27%)
-
Investment: minus 83 thousand ounces (net selling due to outflows from ETFs, etc.)
When combining automobiles and industry, over 70% of demand is ‘buying for use.’ In the same outlook, it is stated that growth in glass and electrical applications for AI and data centers will compensate for the decline in automobile demand.
Supply concentration is also a major characteristic. It is said that South Africa accounts for about 70% of supply from platinum mines. Because producing countries are limited, the power situation and operational status of that country are directly linked to the supply outlook. According to the WPIC, 2025 saw a significant supply deficit (a state where demand exceeds supply) of approximately 1,440 thousand ounces. For 2026, the outlook has changed to a slight supply surplus due to factors such as net selling in investments.
Incidentally, platinum has continued to be traded at a lower price than gold since around 2015. In WPIC materials, ‘significant undervaluation relative to gold’ is cited as one of the reasons supporting jewelry demand.
Reasons they are still put in the ‘same group’
Looking at this so far, the three are quite different. Even so, the reason they are grouped together is that, in the short term, there are many situations where they move in the same direction.
-
All are primarily dollar-denominated, and when the dollar strengthens, they become relatively expensive when viewed from currencies other than the dollar
-
It is generally said that when the outlook for rising interest rates strengthens, precious metals that do not generate interest are easily sold
-
Investment money flows in and out collectively as ‘precious metals.’ The WPIC also commented that platinum will likely move in line with the overall view on precious metals
The third point, in particular, comes into play during sudden price movements. On days when gold is heavily sold, silver and platinum are also prone to being sold off. From a risk management perspective, I believe it is safer not to assume that ‘the content of demand is different, so it provides diversification’.
Handling under my own rules: Summing them up in the same bucket
In the risk limit rules for the Funded7 account I use, instruments are divided into correlation groups (buckets), and gold (XAUUSD), silver (XAGUSD), palladium (XPDUSD), and platinum (XPTUSD) are all included in ‘B10 Precious Metals’.
There are two rules.
-
Rule 2C: A violation occurs if the total risk of instruments in the same bucket exceeds the account type limit (either 3.0%, 2.0%, or 1.0%).
-
Rule 2D: A violation occurs if the total risk of all buckets exceeds the same limit.
For example, in an account with a 3.0% limit, if you enter gold with 1.5% risk and silver with 1.5% risk simultaneously, the B10 total is exactly 3.0%. You cannot add another precious metal here. If gold is 2.0% and silver is 1.5%, the total is 3.5%, which is a 2C violation.
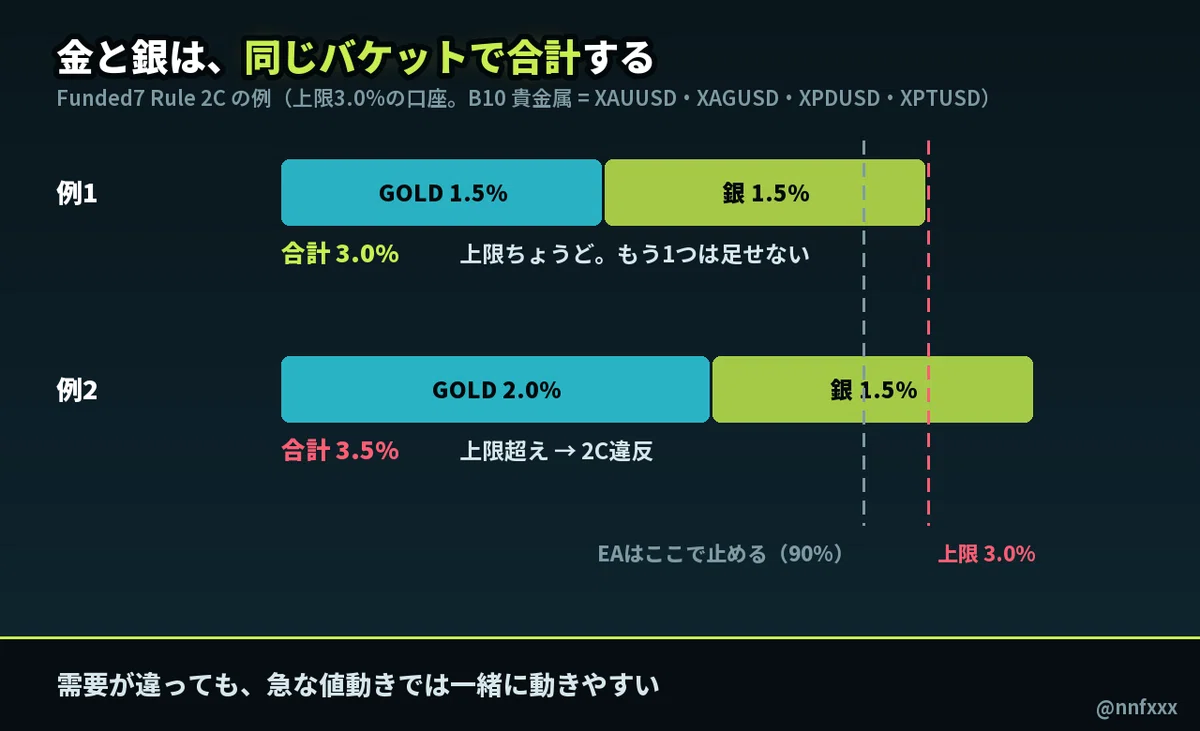
In my EA, I have designed it to stop new orders at 90% of the limit to provide a buffer. At the 3.0% limit in the example above, the EA would not place the second order in the first place.
The strategy itself is the same regardless of the instrument. Higher timeframe perspective, confirmed first wave, pullbacks on the second wave, lower timeframe reversal, and an RR of 1:2 or better. You can use Dow Theory and Elliott Wave analysis for silver and platinum as well. However, there are two things I want to confirm before expanding my scope.
-
Lot size: In futures, gold is 100 ounces, silver is 5,000 ounces, and platinum is 50 ounces. Since CFD specifications also vary by broker, always check the lot calculations against your account’s specifications.
-
Costs and price range: How heavy the spread is relative to the stop-loss width varies by instrument. Do not use the figures you verified for gold as they are.
Summary
-
Gold, silver, and platinum are all dollar-denominated and are similar in that they are influenced by the dollar, interest rates, and investment money flowing into precious metals as a whole.
-
The nature of demand is different. Gold is centered on investment, jewelry, and central banks (2025, WGC), silver is approximately 58% industrial (2025, Silver Institute), and platinum is over 70% automotive and industrial (2026 outlook, WPIC).
-
A large amount of silver is produced as a byproduct, and platinum supply is concentrated in South Africa. The gold-silver ratio moves significantly because the two do not move by the same amount.
-
Even so, they tend to move together during sudden price fluctuations, so for risk management, I treat them as the same group and sum them up rather than considering it ‘diversification’. In my own account rules, the four precious metals are included in the same B10 bucket.
-
If you are going to trade silver or platinum, even if the strategy is the same, check the lot specifications and costs for each instrument.
※ This article is a record of the author’s personal trading rules and is not investment advice. FX and CFD trading carry the risk of losses exceeding the principal. Please trade at your own discretion and responsibility.


