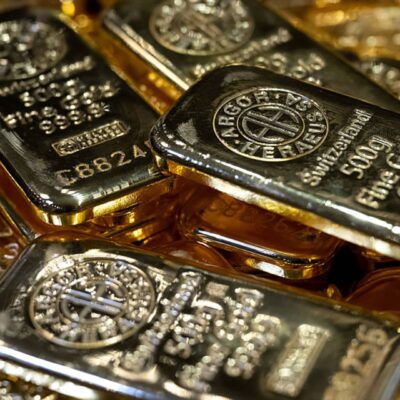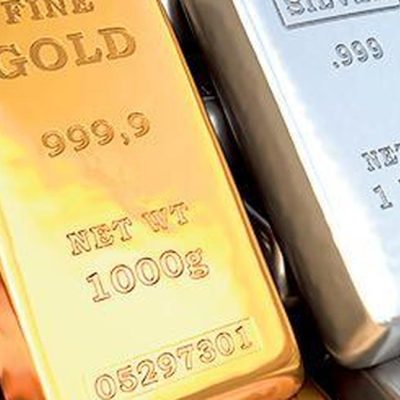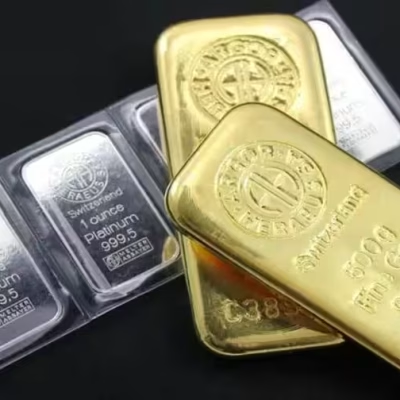

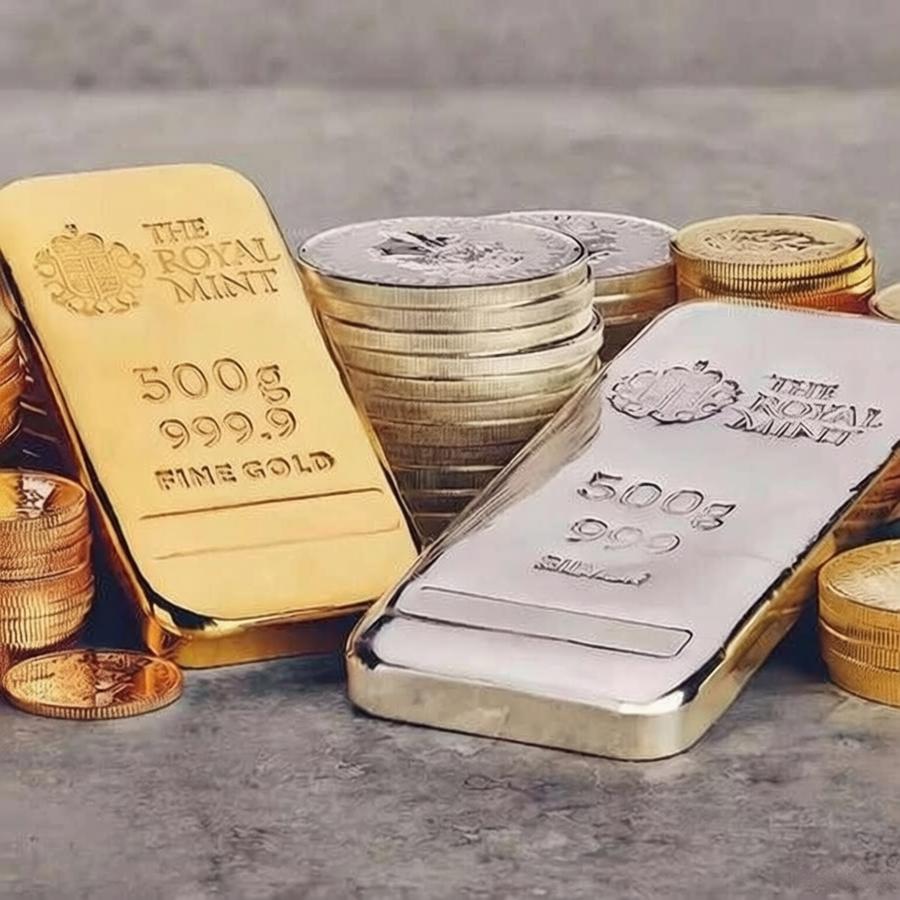

In the first half of the year, the shift in the US Fed’s monetary policy expectations was the core driving force behind the reversal of the precious metal market. Geopolitical tensions did not directly boost safe-haven demand; instead, they stoked inflation via energy price transmission, which in turn indirectly altered the US Fed’s monetary policy trajectory. In the second half of the year, as liquidity tightening expectations keep intensifying and geopolitical tensions persist, gold prices are likely to see broad-range consolidation, with the key trading band projected at $4,000 to $4,800 per ounce. Should clear signs of an economic downturn emerge, gold prices are poised to rally and test the $5,000 per ounce threshold; if inflation rebounds more sharply than anticipated, gold will find support near the $3,300 per ounce mark.
Silver will present a structural feature of “financial attributes following, and industrial attributes leading”. Its price elasticity is usually higher than that of gold, but the driving factors are more complex. On the one hand, silver prices fluctuate with gold prices; on the other hand, silver is more widely used industrially, and the demand for green industries such as photovoltaic and new energy vehicles is the focus, but it is necessary to pay attention to the signs of weakness in industrial demand that have already appeared, which may bring pressure. The global silver market has been in a state of supply and demand shortage for several years, which provides fundamental support for its price. The price fluctuation range of silver is expected to be 50 US dollars ~ 80 US dollars/ounce.
The situation in the Middle East is not yet clear.
Since the beginning of March, the situation in the Middle East has escalated, changing the investment logic of global financial markets, with the main transmission logic being: increased geopolitical risks—skyrocketing oil prices—ping-ponging inflation—tightening of global central bank policies—downward pressure on risk appetite—re-pricing of assets.
In the first half of the year, the situation in the Middle East experienced “full-scale military conflict – long-term proxy confrontation – phased ceasefire between the US and Iran – implementation of the ceasefire agreement – repeated negotiations between the US and Iran”, which became the core driving factor for the short-term fluctuations in the futures prices of precious metals. The market pricing logic has undergone a significant switch: during the phase of intensified conflict, oil prices fueled inflation, and the expectation of US Federal Reserve rate hikes suppressed the prices of gold and silver, weakening the risk-aversion logic; during the phase of easing geopolitical tensions, the decline in inflation led to a repair in the expectations of easier monetary policy, which became the core driving force for the rebound in the prices of gold and silver. Currently, the core disagreement between the US and Iran has not been resolved, and there is uncertainty in the 60-day negotiation window period. In the second half of the year, the prices of precious metals will still be dominated by the monetary policy of the US Federal Reserve, and the continued situation between the US and Iran will amplify the fluctuations in the market.
The US economy is relatively resilient.
In the first half of the year, the US economy showed the characteristics of “strong manufacturing, weak consumption, and continuous adjustment of expectations”. The economic resilience exceeded expectations, which is an important basis for the Fed’s policy shift. In the second half of the year, the economic resilience of the United States still exists. At present, the situation between the United States and Iran is gradually cooling down, accompanied by the recovery of Middle East oil supply and the decline of oil prices at a high level, the global inflation level is gradually stabilizing and falling, and the cost pressure that drags the economy may gradually disappear, but the expectation of tightening liquidity still suppresses the economy, and the macro prosperity is expected to improve marginally.
The annualized quarterly GDP growth rate in the United States was 1.6%, revised down from the initial value of 2.0% by 0.4 percentage points, below the market expectation of 2.0%; personal consumption expenditure increased by 1.4% quarter-on-quarter, a decrease of 0.5 percentage points compared to the previous quarter, and the interest rate-sensitive sectors continued to be under pressure, indicating that the suppression effect of high interest rates on the economy is gradually becoming apparent. After entering the second quarter, manufacturing expansion has led to an upward revision of economic expectations. On June 17, the GDPNow model of the Atlanta Fed predicted that the U.S. economic growth rate in the second quarter could reach 3.0%, significantly exceeding the market’s previous expectations, and the expectation of a “soft landing” for the economy has been rekindled.
The US manufacturing PMI index continues to rise. In May, the US ISM manufacturing PMI rose to 54, reaching a new high in nearly four years, among which, the price index increased by 82.1, although it fell back from 84.6 in April, it is still at a higher level since June 2022, indicating a significant increase in manufacturing inflationary pressure. The service sector PMI marginally declined, recording 54.5 in May, still in the expansion zone but with weakened momentum, and the economic structure differentiation is obvious. In the first half of the year, the manufacturing recovery far exceeded market expectations, becoming the core support for economic resilience.
The growth rate of US household consumption continues to slow down. In the first quarter, the year-on-year growth rate of personal consumption expenditure was 1.4%, down by 0.5 percentage points from the fourth quarter of the previous year. In the first quarter, personal consumption expenditure contributed limitedly to GDP, only driving up 0.95%. The consumer confidence index continues to decline: in May, the University of Michigan Consumer Confidence Index fell to 44.8, a new historical low; in June, the consumer confidence index rebounded slightly to 48.9, but it is still significantly lower than the same period last year, and the suppression of residents’ consumption capacity and willingness by high inflation continues to exist.
At present, geopolitical tensions remain an important factor affecting the economy, and short-term uncertainties are still high. Currently, the market is optimistic about the “geopolitical tensions easing + growth resilience”, and if the Strait of Hormuz does not resume normal navigation, it is necessary to consider the risk of a reversal of expectations.
Inflation and employment data were the core triggers for the shift in market expectations for Fed policy in the first half of the year, and the two factors together prompted the market to reprice the Fed’s monetary policy path. Amid lingering geopolitical tensions, the trajectory of U.S. inflation in the first half of the year outperformed market expectations set at the start of the year, staging a sustained rebound: the year-on-year CPI growth held at a low 2.4% from January to February; it climbed to 3.3% in March on the back of spiking oil prices; it edged higher to 3.8% in April; and it posted a 4.2% year-on-year rise in May, marking the steepest reading since April 2023. Energy prices stood as the core driver of inflation: energy prices rose 3.9% month-on-month and 23.5% year-on-year in May. Core inflation remained relatively subdued: the year-on-year core CPI growth hit 2.9% in May, with its month-on-month gain coming in below the prior print, signalling that the energy shock has not broadly spilled over into core price components. The PCE price index also ticked higher: nominal PCE rose 3.8% year-on-year and core PCE rose 3.3% year-on-year in April, with both figures topping market forecasts.
The May data shows a differentiated pattern of “the overall CPI exceeding 4%, but the core CPI cooling down”. Although the Fed can classify the energy inflation as a one-time shock and continue to maintain the interest rate, the overall CPI exceeding 4%, combined with the strong performance of the non-farm employment report, shows that the absolute level of inflation has seriously limited the Fed’s room for rate cuts.
In addition, the labor market performance has continued to exceed market expectations, becoming an important support for the Fed to maintain high interest rates. In January, the non-farm employment population increased by 160,000, and the unemployment rate fell to 4.3%, alleviating market concerns about the cooling of employment. In May, the non-farm employment population increased by 172,000 after seasonal adjustment, once again significantly exceeding expectations; the unemployment rate remained at 4.3%, and the labor force participation rate remained stable. Strong employment data, combined with a rebound in inflation, overturned the market’s unanimous expectation of Fed rate cuts this year at the beginning of the year, and even triggered pricing for rate hikes this year. The Fed’s June interest rate meeting maintained interest rates, and the dot plot and interest rate statement leaned “hawkish”, which lifted the expectation of rate hikes this year.
Global liquidity tightening expectations continue to heat up
Global monetary policy has undergone a significant shift, with the expectation of global rate cuts at the beginning of the year being broken by a rebound in inflation. The main reason for this is that central bank policies have shifted from “lean towards ease” to “lean towards hawkish”, and even resumed rate cuts. The Federal Reserve’s monetary policy is a core variable affecting the price of gold. At the beginning of 2026, the market widely expected the Federal Reserve to embark on a rate-cutting cycle, and the expectation of rate cuts continued to heat up, driving the US dollar index weaker and becoming the core driving force for the increase in the price of gold. Subsequently, due to the continuation of the situation in the Middle East, the pace of the Federal Reserve’s monetary policy was disrupted.
The Fed issued a very brief policy statement on June 17th local time, and all 12 members of the Federal Open Market Committee (FOMC) agreed that the current policy interest rate should be maintained. The meeting statement said that in order to support the Fed’s dual goals, it was decided to maintain the policy interest rate at 3.5% ~ 3.75%. The FOMC reiterates its policy of maintaining sufficient reserves in the banking system. At the same time, the statement simply describes the current economic situation, saying that although the situation in the Middle East brings uncertainty, US economic activity is still expanding steadily, with strong productivity growth and capital investment, and employment growth is synchronized with labor force growth, with little change in the unemployment rate. The statement also said that inflation levels are still above the FOMC’s 2% target, in part because supply shocks have led to price increases in some industries (including the energy industry).
In addition, the Fed also released the latest dot plot; the federal funds rate forecast for 2026 stands at 3.8%, which is 0.4 percentage points higher than the March forecast of 3.4% and also above the current federal funds rate level. However, only 18 members submitted projections this time, one fewer than at the March meeting. During the subsequent press conference, new Fed Chair Waller confirmed that he did not submit a forecast. In the latest dot plot, nine of the 18 submitting members believe interest rate hikes will be necessary before the end of the year.
In economic forecasting, the Fed has lowered its growth and unemployment rate predictions and raised its inflation forecast. In terms of growth predictions, the year-on-year growth rate of actual GDP in the fourth quarter of 2026 has been lowered by 0.2 percentage points, to 2.2%; in terms of inflation predictions, the year-on-year growth rate of PCE and core PCE in 2026 has been significantly increased by 0.9 percentage points and 0.6 percentage points, respectively, to 3.6% and 3.3%, with a slight increase in 2027, and PCE inflation returning to 2% in 2028; in terms of unemployment rate predictions, the unemployment rate in 2026 has been lowered by 0.1 percentage points, to 4.3%, and has remained unchanged in 2027-2028.
Wash’s Fed “debut” was as expected. He changed the Fed’s communication framework, reduced the guidance on monetary policy, and downplayed the dot plot, and the first policy statement released also removed the forward guidance, simply giving the voting results.
While the probability of a preemptive rate hike has increased, the baseline scenario remains keeping rates unchanged in the second half of 2026. Wash declined to offer forward guidance on interest rates during the press conference, yet the hawkish dot plot implies the odds of a preemptive rate hike later this year will rise if upcoming employment data keep strengthening and inflation stays elevated. Given the labor market may cool slightly going forward, alongside falling oil prices, fading tariff effects, and sustained slow growth in housing costs and wages — all factors that help curb inflation — markets expect the Fed to hold rates steady through July, with the probability of a September rate hike topping 70%.
The European Central Bank announced a 25 basis point interest rate hike on June 11, raising the deposit facility interest rate to 2.25%. This is the first interest rate hike since September 2023, breaking a year-long period of interest rate stability. The core reason for the interest rate hike is the conflict involving the United States, Israel, and Iran, which has pushed up energy prices. Eurozone inflation has rebounded rapidly after falling within the 2% target zone at the start of the year, climbing to 3.2% in May, and the risk of inflation de-anchoring has risen markedly. The European Central Bank also revised down its economic growth forecast and revised up its inflation forecast. This interest rate hike is viewed by the market as a precautionary rate hike, intended to anchor inflation expectations and prevent second-round inflation effects sparked by the energy shock. Markets expect this to be the European Central Bank’s sole rate increase in the current cycle, with rates set to stay unchanged afterward, and rate cuts likely to resume in 2027.
In addition, the Bank of Japan announced on June 16 that it would raise the benchmark interest rate by 25 basis points to 1%, the highest level since 1995. This rate hike was in line with market expectations. The Bank of Japan warned in a statement that the core CPI inflation rate could deviate from the price target, and the year-on-year increase in the CPI may accelerate to a level significantly higher than 2%. It also stated that the transmission of the rise in oil prices is progressing at a “relatively fast pace” and may spread and push up consumer prices for a wide range of goods and services. The Bank of Japan also stated that it will continue to raise policy interest rates based on the development of economic activity, prices, and financial conditions. The Bank of England maintained the interest rate at 3.75% (the fourth consecutive time), and it is expected that the UK’s fourth-quarter CPI will rise above 3.25%.
Overall, global central bank monetary policies may enter a period of tightening, and geopolitical tensions remain a key factor affecting the timing of policy shifts. If the U.S.-Iran agreement leads to a sustained decline in oil prices, the easing of inflationary pressures may weaken the case for rate hikes, and the “hawkish” expectations could have room to retreat. If conflicts in the Middle East continue, high oil prices could further boost inflation expectations, and the timing of rate hikes may be further advanced.
Global central banks buying gold to support gold prices
The continuous purchase of gold by the global central banks is one of the core logic supporting the medium and long-term trend of gold prices in recent years. This trend has been continued in 2026, and the continuous increase in gold holdings by global central banks has provided a solid demand support for the gold market. According to the data released by the Chinese central bank on June 7, by the end of May, China’s gold reserves increased to 74.96 million ounces, with an increase of 3.2 million ounces in the month, marking 19 consecutive months of increase. The continuous purchase of gold in the context of downward pressure on gold prices shows a medium and long-term allocation strategy. From the logic of the increase, the Chinese central bank mainly aims to optimize the structure of foreign exchange reserves, reduce reliance on US assets, and at the same time hedge against geopolitical risks and inflationary pressures.
The report released by the European Central Bank shows that by the end of 2025, the proportion of gold in the total global official reserve assets has increased from 16% at the end of 2023 to 27%, exceeding the US Treasury bonds by 5 percentage points, becoming the first largest asset in global official reserves. Even though the short-term gold price is under pressure due to the rise in US Treasury bond yields and the strong performance of the US dollar index, the global central banks are still continuously increasing their holdings on a strategic level. This is not only a structural adjustment of reserves but also a clear signal of the profound restructuring of the global monetary system. According to the World Gold Council, in April, the global central banks turned back into net buyers of gold, with a net purchase of 17 tons, compared to a net sale in March.
The impact of the global central banks’ gold purchases on the gold market is mainly reflected in two points. First, it provides a stable demand support. The gold purchases by global central banks belong to “non-price elastic demand”. They will increase their holdings according to their own strategic needs, regardless of the high or low gold prices. This continuous buying behavior has built a solid bottom for gold prices and avoided the trend of falling gold prices. Second, the continuous increase in gold holdings by global central banks essentially affirms the status of gold as a “final safe asset”. It is worth noting that the short-term reduction in gold holdings by some central banks may trigger slight fluctuations in the gold market. However, from a holistic perspective, the long-term trend of gold purchases by global central banks has not changed. This strategic demand will continue to support the medium and long-term trend of gold prices.
Silver industry demand expected to remain stable
In the past few years, the photovoltaic industry has led the industrial demand for silver, driven by the new energy revolution led by China. Over the past four years, the global silver supply has been about 20,000 tons short, which is roughly half a year’s global production. It is expected that the global silver supply and demand gap will reach 14,400 tons in 2026, and the gap will be wider than in 2025, still at a high level, and the global silver supply shortage may further support the silver price.
According to the World Silver Association data, the global total supply of silver is expected to be 33,167 tons in 2026, a decrease of 7,47 tons compared to 2025, of which, the mine supply is 26,254 tons and the recycled silver is 6,571 tons. In terms of demand, the global total demand for silver is expected to be 34,606 tons in 2026, a decrease of 560 tons compared to 2025. Among them, the total industrial demand has been declining for three consecutive years. In 2025, the total industrial demand for silver was 20,447 tons, and it is expected to be 19,894 tons in 2026, accounting for 57% of the total demand for silver. The demand for silver in the photovoltaic industry continues to decline, and it is expected that the demand for silver in the photovoltaic industry in 2026 will be 4,698 tons, a decrease of 932 tons compared to 2025. The physical demand increased in 2026, and it is expected to be 8,013 tons.
Under the comprehensive influence of macroeconomic and geopolitical factors, the overall precious metal prices maintain a range of fluctuations, the driving logic of gold and silver may be somewhat differentiated, and the value of gold being overvalued still exists.
SunSirs has been continuously tracking price data for over 200 commodities for nearly 20 years, please contact support@sunsirs.com for subscription.
[Copyright Notice] In the spirit of openness and inclusiveness of the Internet, ChemNet welcomes all media and institutions to reprint and quote our original content. If reprinted, please mark the source ChemNet. If you find any copyright issues with articles on this website, please contact us at info@netsun.com.