

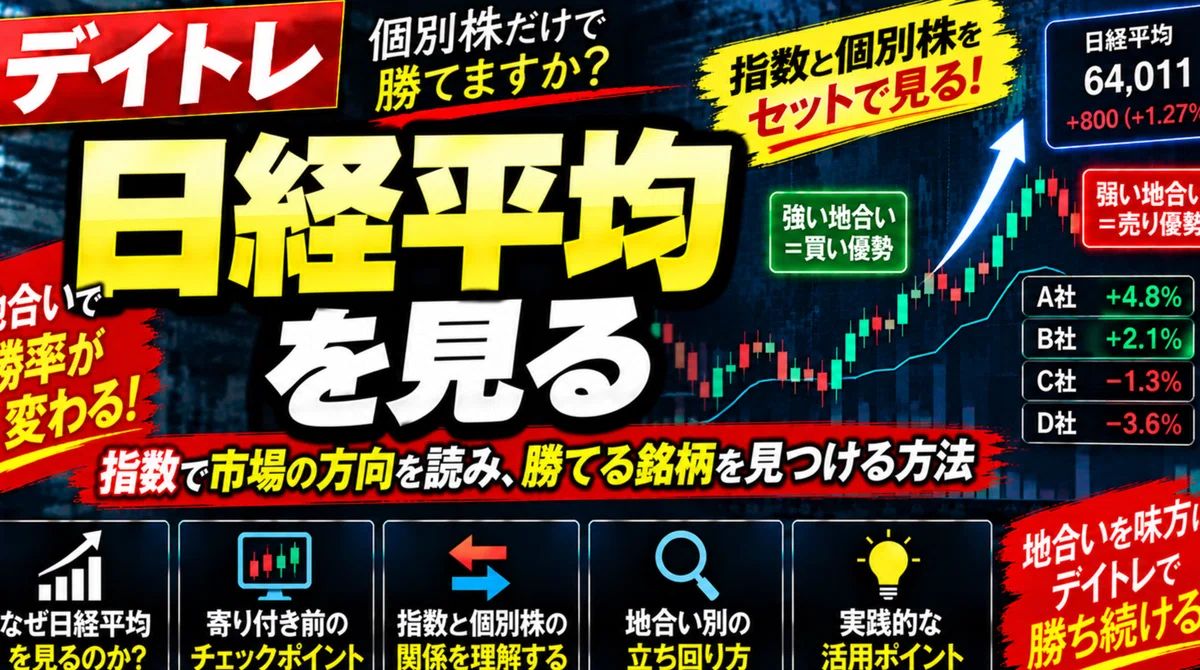
When day trading,
are you only looking at individual stock charts?
For example,
“This stock looks like it will go up”
“It bounced off the VWAP”
“It has dropped to the 5-minute 25MA”
Of course, looking at individual stocks is important.
However, I
do not base my entry decisions solely on individual stocks.
What I place significant importance on is
indices like the Nikkei 225, which represent the market sentiment.
is.
Even if an individual stock looks strong, it may be sold off if the Nikkei 225 plunges.
Conversely, even if an individual stock drops once, it may be bought again if the Nikkei 225 is strong.
In other words,
I look not only at “what to buy,” but also at “whether the current market environment is favorable for buying.”
This is the fundamental approach to my day trading.
In this article, I will explain how I use indices like the Nikkei 225 in my day trading.
Live streaming every day at 8:30 AM on YouTube!
“How much can I grow 1 million yen?”
In this episode, I entered a long position on Furukawa Electric and took profit, and entered a short position on SUMCO and took profit. It was a session where I made about 80,000 yen in the morning market. I think the timing of entries and profit-taking will be helpful.
I hold a day trading live stream every weekday morning from 8:30 AM.
On YouTube, I live stream day trading every weekday morning from 8:30 AM.
Before the 9:00 AM market open, I check:
-
Nikkei 225 futures
-
US market
-
Exchange rates
-
News and materials
-
Daily charts
-
Quote prices
-
Focus sectors
-
Watchlist stocks
and so on.
In particular,
“whether to look for buying or selling opportunities today”
is quite important when considering index movements.
Even after 9:00 AM, I don’t just look at individual stocks; I make entry decisions while comparing them to the movements of the Nikkei 225 and other indices.
If you want to know how I actually combine indices and individual stocks, please use my morning live streams as a reference.
Why do I watch the Nikkei 225 for day trading?
The reason is simple.
Individual stocks are influenced by the market as a whole
is why.
For example,
Stock A is very strong.
However, suddenly,
the Nikkei 225 plunges.
Then,
selling also occurs in Stock A.
This can happen.
Of course, not all stocks move in the same way as the Nikkei 225.
That is precisely why
comparing indices with individual stocks
becomes important.
What is the Nikkei 225?
The Nikkei Stock Average is
a stock index composed of representative 225 stocks listed on the Tokyo Stock Exchange Prime Market.
It is not the entire Japanese stock market itself, but
it is one of the representative indices for observing the movement of the Japanese stock market.
In day trading,
Not just “is the Nikkei 225 rising right now”
or “is it falling”
but also,
in which direction it is starting to move
is what I look at.
Knowing the Nikkei 225 is positive is not enough
For example,
the Nikkei 225 is up 500 yen.
Looking only at this,
you might think,
“The market sentiment is strong today.”
However,
it was up 1,000 yen in the morning.
From there,
it has fallen from
+800 yen
to
+600 yen
to +500 yen
down to the current level.
In this case,
it is still positive compared to the previous day, but
the trend for the day is weakening.
In other words,
It is not just about “whether the change from the previous day is positive or negative”
but also
which direction it is currently moving in
that is important to look at.
Conversely, it can sometimes be strong even when it is negative.
For example,
the Nikkei 225 is down 800 yen.
From there,
-600 yen
↓
-400 yen
↓
-200 yen
it recovers to that level.
It is still negative compared to the previous day.
However,
the trend for the day is upward
.
At this time,
individual stocks that were being sold off may rebound all at once.
Therefore,
rather than the index number itself,
the direction of the index
is what I place significant importance on.
Read also: About the day trading practice game, membership, and free gifts created by an active trader
1. Check Nikkei 225 futures before the market opens
In day trading, you prepare before 9:00 AM.
Before the market opens, I
check Nikkei 225 futures
.
For example,
after the cash market closes the previous day,
if US stocks rise significantly,
and Nikkei 225 futures also rise,
then
the Nikkei 225 may open higher the next morning.
Conversely,
if US stocks plummet,
and Nikkei 225 futures also drop significantly,
then
Japanese stocks may also have a weak opening.
However, high futures do not necessarily mean you should buy.
This is important.
For example,
Nikkei 225 futures are up 800 yen.
“Today is strong!”
you think, and buy at 9:00 AM.
However,
after the market opens,
+800 yen
↓
+500 yen
↓
+200 yen
it plummets.
Individual stocks are sold off along with it.
This kind of thing happens.
In other words,
futures before the market opens are just a predictive factor, and the actual price movement after 9:00 AM is what matters
.
② Watch the initial movement of the index when it hits 9:00 AM
After the market opens,
check whether the Nikkei 225
is heading up
or heading down.
Confirm this.
For example,
Opens high
↓
continues to rise
then,
there is a possibility that a strong market sentiment is continuing.
On the other hand,
Opens high
↓
immediate sharp drop
then,
it could be a ‘yori-ten’ (opening high and falling).
there is also a possibility of.
It is important not to judge based solely on the opening price.
③ Compare the Nikkei 225 with individual stocks
This is the part that I place a lot of importance on.
For example,
Nikkei 225 +1%.
Stock A +1%.
Stock B +3%.
Stock C +6%.
then,
Stock C is significantly stronger than the overall market.
I pay attention to such stocks.
In other words,
the purpose of watching the index is not just to see the market direction.
It also serves as a
benchmark
for measuring the strength of individual stocks.
Strong market sentiment × strong stock
What I find easiest to consider buying is
strong market sentiment × strong stock
.
For example,
The Nikkei 225 is rising.
Semiconductor stocks are also rising.
Among them, Stock A is particularly strong.
Furthermore,
The daily chart is also strong.
It is above the VWAP.
It is bought even on dips.
This is the kind of situation.
I look for
points where the market trend and the direction of individual stocks align.
aim for.
Weak market sentiment × weak stock
It is the opposite for short selling.
For example,
The Nikkei 225 plunges.
Semiconductor stocks are also weak.
Among them, Stock A is particularly weak.
Below VWAP.
Below the 5-minute chart 25MA.
It gets sold off even when it rebounds.
In this case,
weak market sentiment × weak stock
is the situation.
We consider selling into the rallies of such stocks.
The thing to be most careful about is the “opposite direction to market sentiment”
For example,
The Nikkei 225 plunges.
The entire market is weak.
However,
only the stock I am watching is rising.
In this case,
it may be a very strong stock.
On the other hand,
it could also get caught up in a sudden market downturn.
Therefore,
“Just because this stock is strong, it’s fine”
is not how I think.
Why is it strong?
Is there news?
Is the sector also strong?
Is there volume?
I check these things.
Be careful of “stocks that are weak even though the Nikkei 225 is rising”
Conversely,
the Nikkei 225 is rising significantly.
Many stocks are also rising.
Yet,
only stock A is in the negative.
This is,
a possibility of being quite weak
there is.
For example,
Nikkei 225 +2%.
Sector +3%.
Stock A -2%.
In this situation,
the entire market is being bought, but only Stock A is being sold.
I,
place importance on discrepancies with the index like this.
What happens to a weak stock when the market sentiment is strong, if the market sentiment worsens?
This is also important.
Even though the Nikkei 225 is +2%,
Stock A is -2%.
It is already weak.
After that,
the Nikkei 225,
+2%
↓
+1%
↓
±0%
falls to.
Then,
Stock A, which was already weak,
There is a possibility that it will be sold off further.
In other words,
stocks that are weak even in a strong market environment can become even weaker when the market environment deteriorates
.
This is a way of thinking that can also be used when looking for stocks to short sell.
Also look at stocks that are strong even when the market environment is weak
Conversely,
Nikkei 225 -2%.
The entire market is falling.
However,
Stock A +3%.
This is quite strong.
After that,
the Nikkei 225,
-2%
↓
-1%
↓
±0%
rebounds.
Then,
Stock A, which was strong to begin with, may rise even further.
In other words,
stocks that move in the opposite direction to the index are a hint for judging the strength or weakness of the day
is what it becomes.
Look at sectors, not just the Nikkei 225
I do not
rely solely on the Nikkei 225.
For example,
the Nikkei 225 is up 1%.
However,
semiconductors are down 3%.
banks are up 4%.
automobiles are up 2%.
This kind of situation happens.
In this case,
I do not decide to buy semiconductor stocks just because the Nikkei 225 is up.
What is important is
the order of
index → sector → individual stock
.
Think in terms of “index → sector → individual stock”
For example,
Nikkei 225 is strong
↓
semiconductors are also strong
↓
Stock A is strong among semiconductors
then,
it becomes easier to consider buying.
Conversely,
if the Nikkei 225 is weak
↓
and semiconductors are also weak
↓
and stock A is even weaker
then,
it becomes easier to consider short selling.
I look at things
from the big picture down to the small details.
I will observe.
Combining VWAP and Indices
For example,
an individual stock falls to its VWAP.
Normally, this is a situation where you would consider buying the dip.
However,
at that moment,
the Nikkei 225 plummets.
In that case,
there is a possibility it will break below the VWAP.
Conversely,
an individual stock pulls back to its VWAP.
At the same time, the Nikkei 225 rebounds.
The sector also rebounds.
Individual stocks are also bought at the VWAP.
In that case,
it becomes easier to consider it a dip.
Combining the 5-minute 25MA with the index
The 5-minute 25MA is the same.
For example,
a strong stock corrects down to the 25MA.
At the same time, the Nikkei 225 is also pulling back.
After that,
the Nikkei 225 rebounds.
The individual stock also rebounds from the 25MA.
In this case,
the index and the individual stock are moving upward at the same time.
I look for this kind of correlation.
Re-evaluate individual stocks if the index changes suddenly
In day trading,
market conditions can change in a matter of minutes.
For example,
The Nikkei 225 suddenly plunges.
Futures are also falling.
Many stocks are being sold off all at once.
In this case,
if you only look at individual stocks,
thinking, “It was strong until just now, so I’ll hold onto it”
requires caution.
If the market sentiment has changed, you should also re-evaluate your scenario.
“Everything is below VWAP” is a sign of deteriorating market sentiment
I watch multiple stocks.
For example,
if many of the 10 stocks I am monitoring
all fall below their VWAP
at the same time,
this is
not just an issue with individual stocks,
but a possibility that buying across the entire market is weakening.
there is.
Rather than looking at just one stock,
by lining up and watching multiple stocks, it becomes easier to notice changes in market sentiment.
You do not need to be perfectly synchronized with the Nikkei 225
Of course,
individual stocks do not always move exactly the same way as the Nikkei 225.
Stocks with specific news catalysts.
Stocks with earnings reports.
Thematic stocks.
Small-cap stocks.
These may sometimes move differently from the index.
Therefore,
buying because the Nikkei 225 went up
is not a simple method to follow.
The Nikkei 225 is,
above all,
used as one indicator to gauge the overall market sentiment
as a whole.
7 points I look at when checking the index
I will summarize them at the end.
1. Nikkei 225 futures before the market opens
Check where Japanese stocks are likely to start.
2. Initial movement after the market opens
Will it continue to rise after opening high, or will it be sold off?
3. Direction of the index
Look not only at the change from the previous day, but also at whether it is currently trending upward or downward.
4. Sectors
Which industries are receiving capital?
5. Comparison with individual stocks relative to the previous day
Look for stocks that are stronger or weaker than the index.
6. VWAP and 25MA
Check if the key points for individual stocks align with the movement of the index.
7. Sudden changes in market conditions
If the index changes suddenly, re-evaluate your scenario for individual stocks.
Don’t look at “only individual stocks” for day trading
In my day trading,
I do not trade by looking only at the charts of individual stocks.
First,
check the market conditions.
Next,
look at strong and weak sectors.
And then,
look for strong and weak stocks within those sectors.
In other words,
Index
→
Sector
→
Individual stock
is the order.
For buying,
Strong market sentiment × strong sector × strong stock.
For short selling,
Weak market sentiment × weak sector × weak stock.
Furthermore,
Daily chart.
Change from previous day.
VWAP.
5-minute chart 25MA.
Trading volume.
are combined.
If you only look at individual stocks,
you might wonder,
“Why did it suddenly drop?”
However, if you look at the index,
it turns out the Nikkei 225 had actually collapsed first.
This can happen.
That is why I
place significant importance on
watching the overall market trend
at the same time as individual stocks when day trading.
I host a live day trading stream on YouTube every weekday morning starting at 8:30 AM.
Before the market opens, I check Nikkei 225 futures and my watchlist, and from 9:00 AM onwards, I monitor both the index and individual stocks to decide whether to buy, sell, or do nothing.
If you would like to see how I use market conditions in actual day trading, please feel free to use my morning live stream as a reference.
Related Articles
[Watch the Previous Day’s Comparison for Day Trading] How to Identify Strong and Weak Stocks at the Opening
This article explains how to find stocks that are relatively strong or weak compared to the Nikkei 225 and industry peers.
[Day Trading Entry Timing] Explaining When to Buy and When to Wait
This explains the logic behind entries that combine market conditions with individual stocks.
[How to Buy the Dip in Day Trading] Explaining Points to Target in an Upward Trend
This explains how to look at situations where strong stocks pull back during a strong market environment.
[How to Short Sell in Day Trading] How to Find Weak Stocks and Target Declines
This explains the logic behind searching for weak stocks during a weak market environment.
*This article does not recommend specific stocks or trading methods, nor does it guarantee profits. Please make investment decisions at your own risk.
If you wish to purchase the Day Trading Game, please visit the pinned page.